Last week I shared the post “Is Solar Smart?: Reaching Net Zero, Part I,” based on my presentation for the Net Zero Innovations panel at the Seattle meeting of the Northwest EcoBuilding Guild. Today I continue on the theme with “Performance Matters, Reaching Net Zero, Part II.”
For the reasons laid out in last week’s post, we believe it’s time for high performance builders to embrace solar. The “eco-bling” arguments against it have been made passé by huge drops in price over the last several years, and the commonsensical argument that solar PV generates energy in the summer when “we don’t need” it is wrong. Demand for electricity on our grid spikes every summer in our region, exactly when PV produces the most energy.
But solar still only makes sense if we optimize building performance first. There are lots of reasons for this, including the health and happiness benefits of high performance building, the long-term and once-in-a-building’s-lifetime nature of investments in a building’s shell, and the superior durability that high performance buildings promise.
(Visit our High Performance Building and Zero Energy Homes pages to learn more about H&H’s approach, including project examples, videos, and articles.)
All of these arguments are important. But in the net zero or net positive energy context, the argument for optimizing building performance often comes down to simple math and limited space.
PERFORMANCE MATTERS
Net zero energy math is based on this equation:
Energy Consumption + Onsite Generation = Zero (on a net basis, annually)
You need to limit the energy your building consumes so that the energy that you’re generating onsite with your solar panels or other renewables can offset it. (An aside: net zero energy building should not become a zero-sum game that pits energy efficiency against onsite generation. Given that both energy efficiency and renewable energy production are societal “goods,” incentive programs and market mechanisms should be designed to reward both in parallel, reaching beyond zero to net positive when it makes sense.)
Building performance and energy generation are intertwined. This diagram based on an excellent illustration by The Miller Hull Partnership illustrates the principle, using the Bullitt Center as an example:
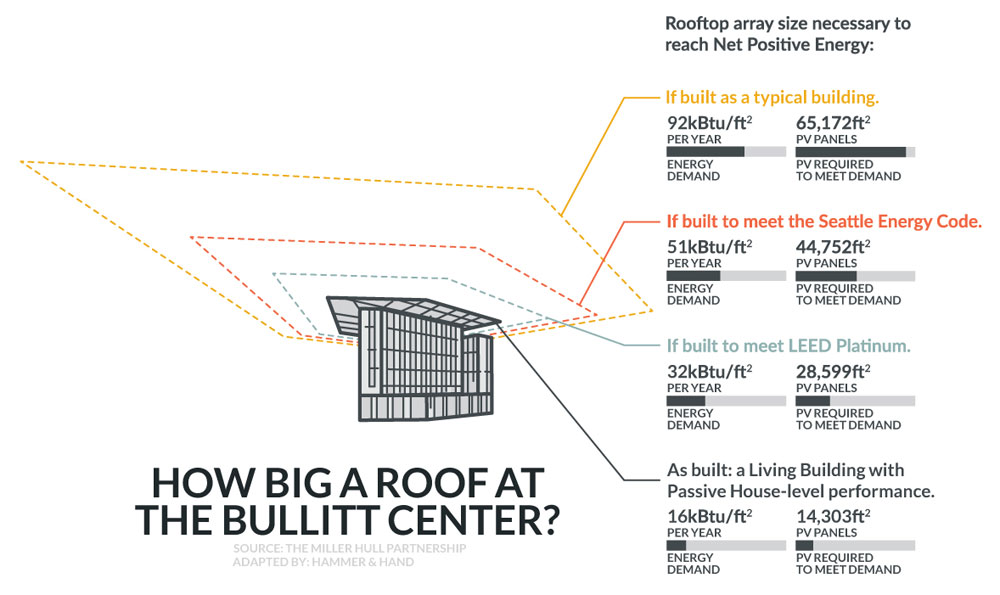
At the yellow polygon shows how large the Bullitt Center’s rooftop solar array would need to be to reach net zero energy if the building were built to the same levels of building performance as existing commercial buildings (an Energy Use Intensity, or EUI, of 92 kBtu/sf/yr.) It would literally span an entire city block.
The red polygon shows how large the array would need to be to reach net zero energy if the building were built to Seattle Energy Code at the time (EUI of 51 kBtu/sf/yr). Next blue/gray shows the roof size for LEED Platinum levels of performance (EUI of 32 kBtu/sf/yr) and the final polygon shows the size of the rooftop as it was built. The Bullitt Center’s EUI of 16 kBtu/sf/yr enables the building to reach net zero energy with a rooftop solar array that just barely juts out over the building’s footprint, limited to the sidewalk right of way surrounding the structure.
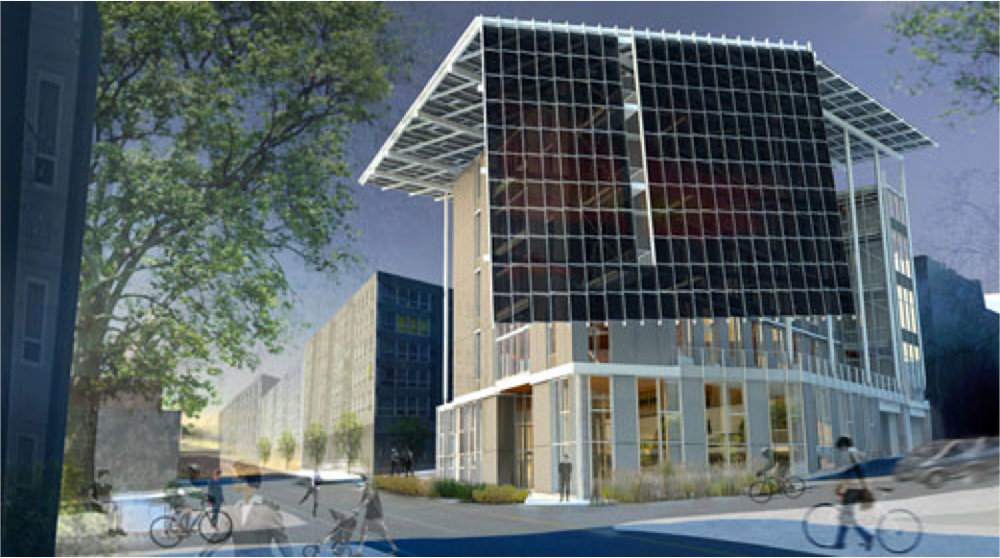
Before the Bullitt Center design team had fully dialed in the building’s performance it was experimenting with a “solar wall” of panels cascading down one façade of the structure.
 Source: The Miller Hull Partnership
So the Bullitt Center might have looked like this:
Source: The Miller Hull Partnership
Instead, it looks like this:

Source: The Miller Hull Partnership
This not only illustrates the intimate relationship between building performance and onsite generation, it also shows the power of high performance building to free up the designer to do great design.
Similarly, our Karuna House project shows the impact of performance on array size. This net positive project was a case study in green building certifications, the first building ever to achieve Passive House, LEED, and Minergie certification. So it boasts great building performance.
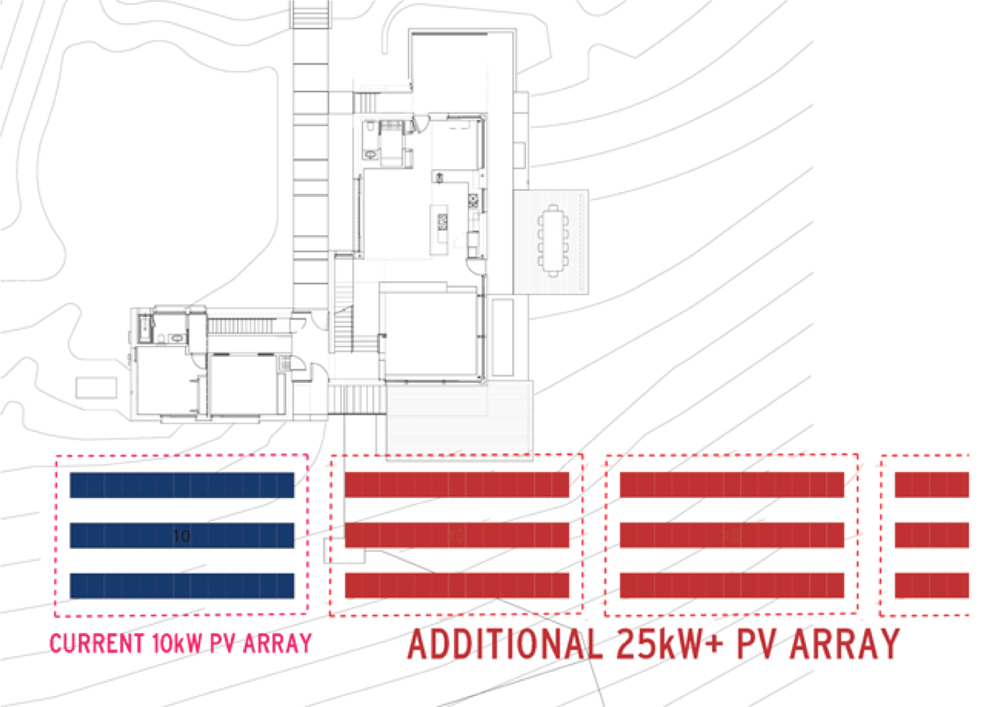
The image above shows in blue the 10 kW PV array that brings it to net positive energy. The red shows how much land that array would have to gobble up to reach net zero energy if the house were built as a conventional structure. As built, Karuna House’s PV array is fairly modest:
Karuna House’s superior energy performance allows a fairly large house to achieve net positive energy with a fairly small array.
WHAT’S TRUE AT THE BULLITT CENTER IS TRUE FOR NET ZERO IN GENERAL
What we’re finding in our net zero projects is that the same dynamic that is at work at the Bullitt Center is at work on all sites, especially urban ones in Portland and Seattle. Limited space drives demand for higher building performance. I spoke recently with H&H Passive House expert Dan Whitmore at our Seattle office and he told me that the maximum practical solar array size in Seattle is usually 6.6 kW, driven mainly by space limitations but also by price (inverter size has to jump considerably when you exceed 6.6 kW so small incremental increases above 6.6 kW often don’t make sense.)
Dan also said he’s seeing, based on performance tracking of our projects, that real-world power generation for a 6.6 kW comes in at about 5,800 kWh/yr. So, for a typical net zero or net positive project, that gives us our annual “energy budget.” Building energy consumption needs to come in at or below that number in order to achieve net zero.
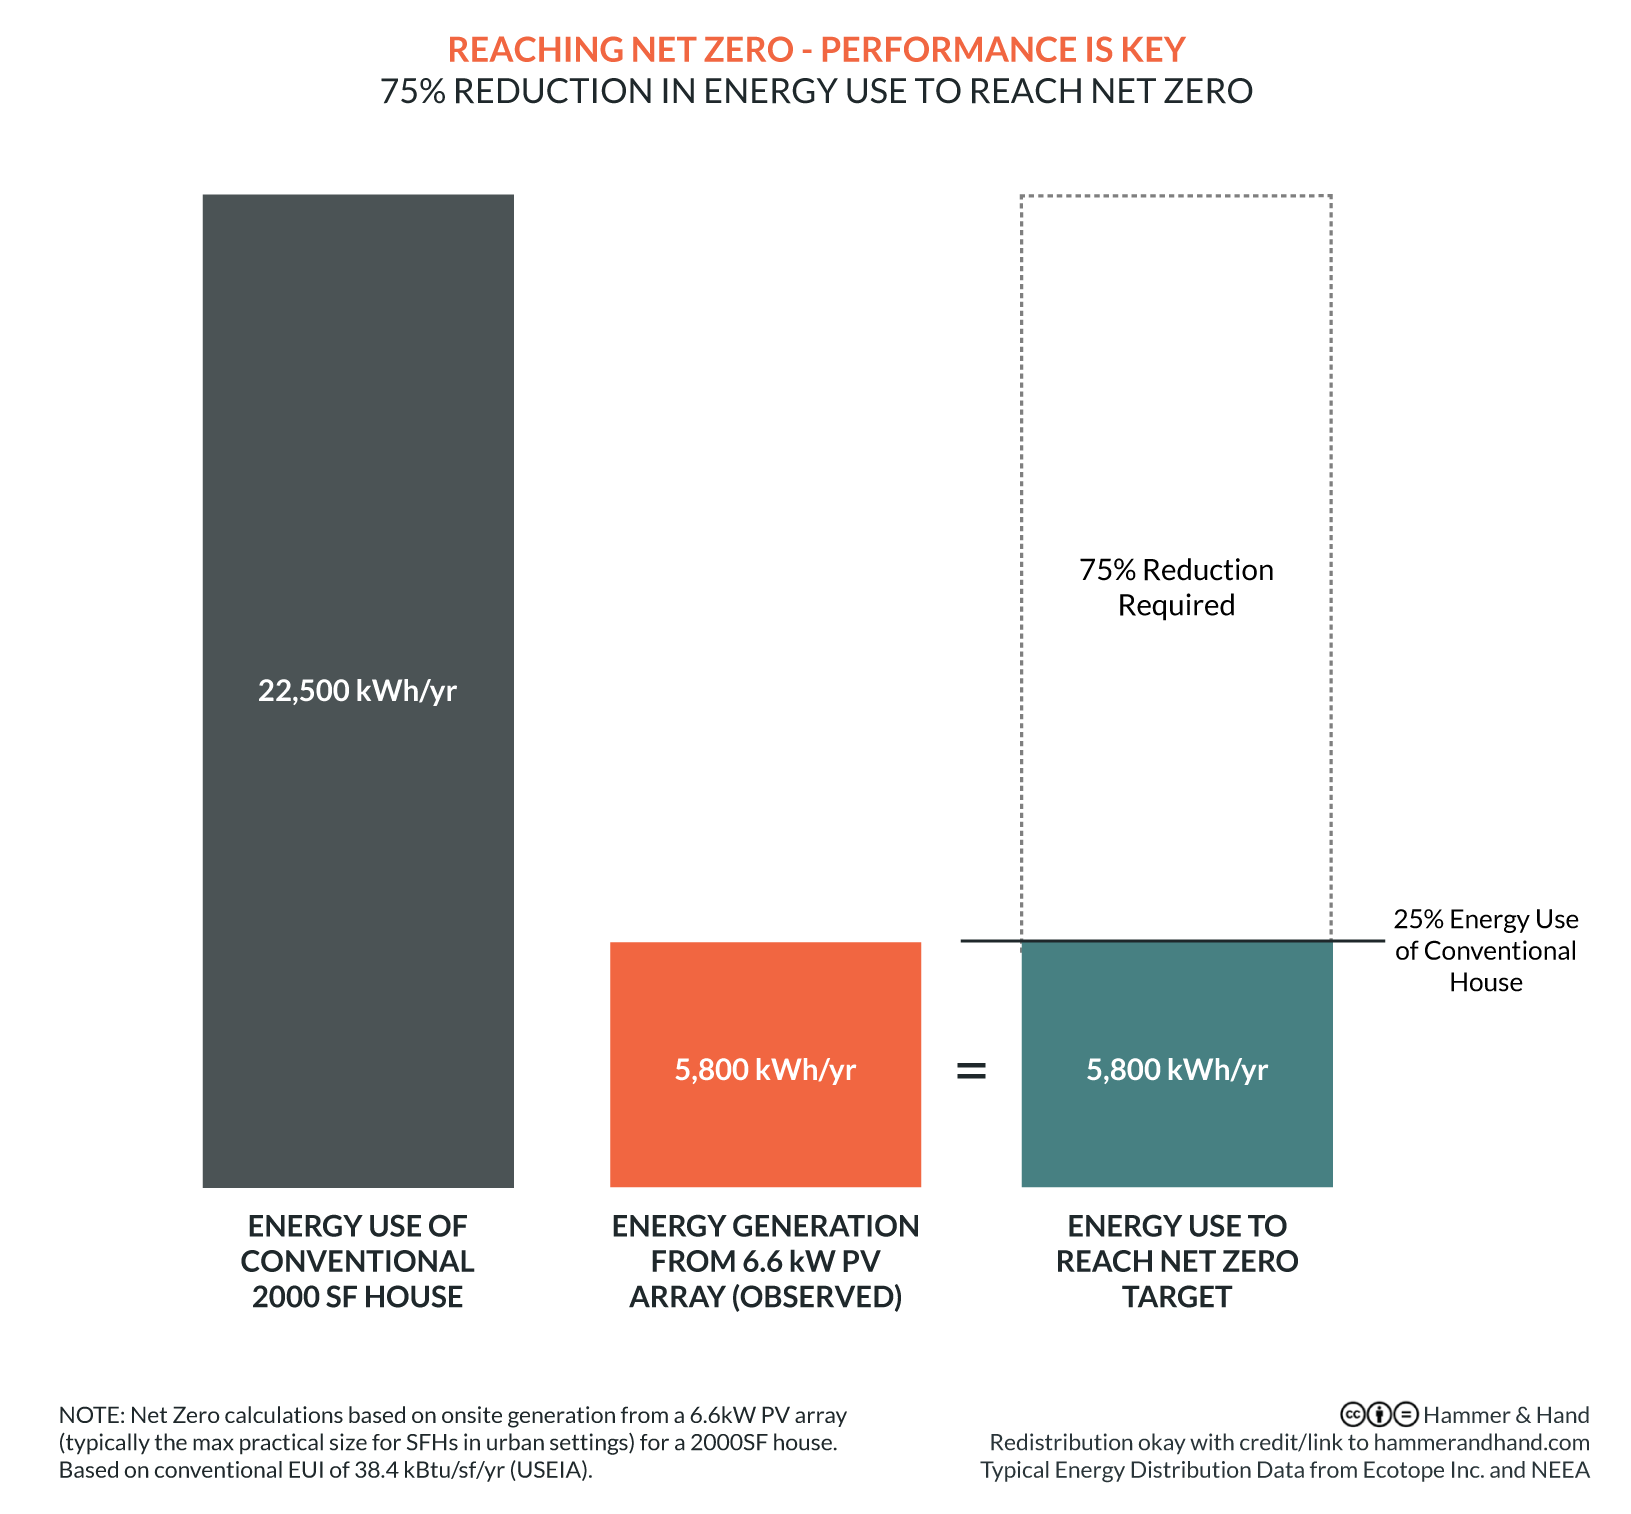
Okay, time for some math. According to the US Energy Information Administration, the typical house in the West has an EUI of 38.4 kBtu/sf/yr. Applying the 1 kWh = 3.412 kBtu conversion factor, that EUI is 11.25 kWh/sf/yr. Therefore, the typical 2,000 sf house consumes 22,509 kWh/yr.
We only have 5,800 kWh/yr of power available from our hypothetical 6.6 kW array. That means we’re going to have to reduce the energy consumption of our 2,000 sf house from 22,509 to 5,800 kWh/yr. So, to reach net zero energy in Seattle or Portland, our house will need to use 75% less energy.
The Passive House approach to building is the only strategy we know that can reduce building energy use by 75%.
WHAT IS PASSIVE HOUSE? A QUICK PRIMER & EXAMPLE
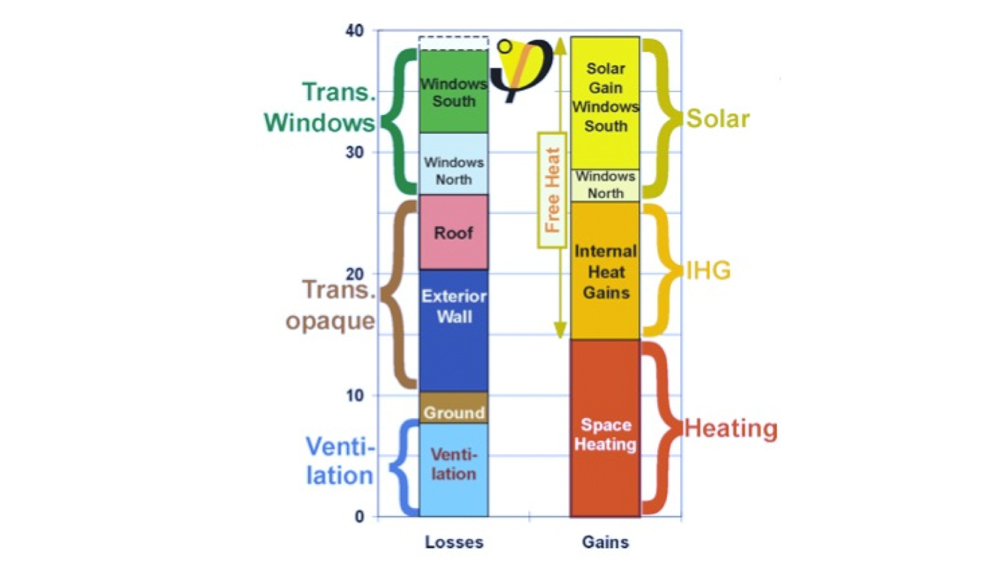
At it’s simplest, Passive House is an approach to design and construction that minimizes energy losses, optimizes energy gains, and then balances the two. By pushing down energy demand for heating (and cooling) by as much as 90%, Passive House structures can be heated by roughly equal parts of solar gain, internal heat gain (body heat and heat from appliances), and active heating, as shown in this diagram from Passivhaus Institute:
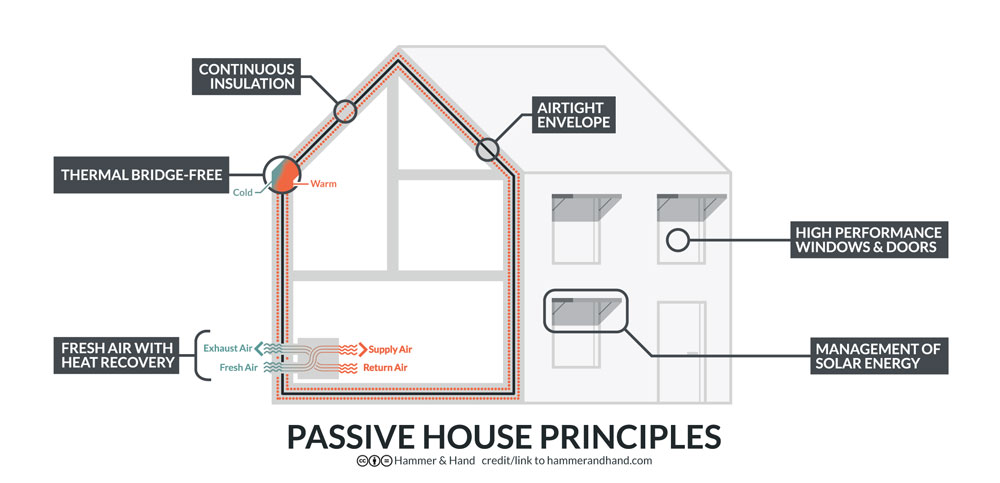
All of this is achieved through a building science-guided application of the following principles:
- Airtight Envelope
- Continuous Insulation
- High Performance Windows and Doors
- Thermal Bridge-Free
- Fresh Air Ventilation with Heat Recovery
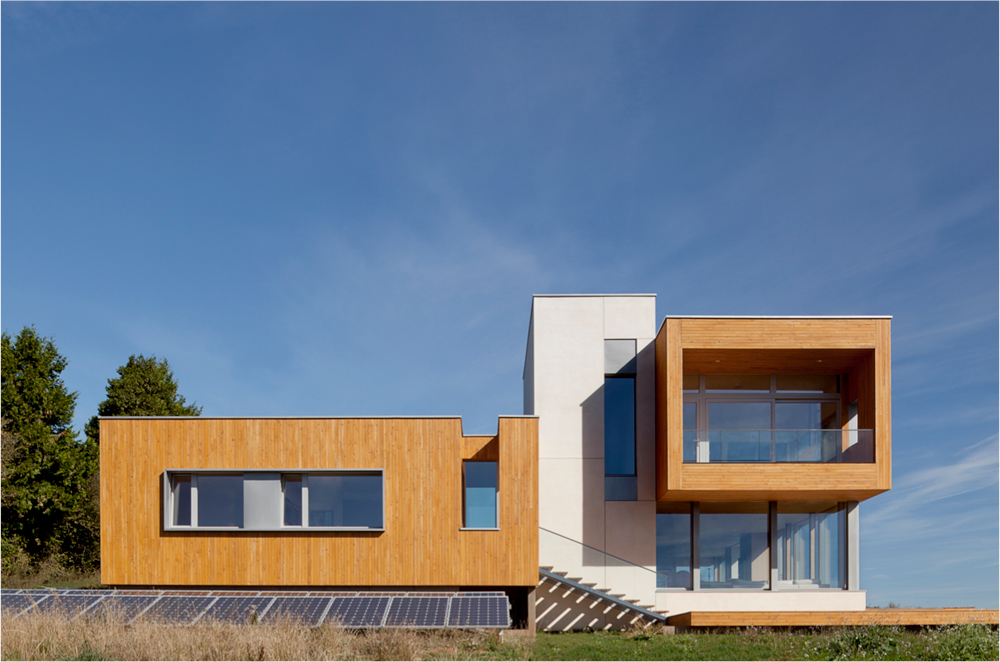
For a quick illustration of these principles in action, let’s take a look at Karuna House, mentioned earlier.
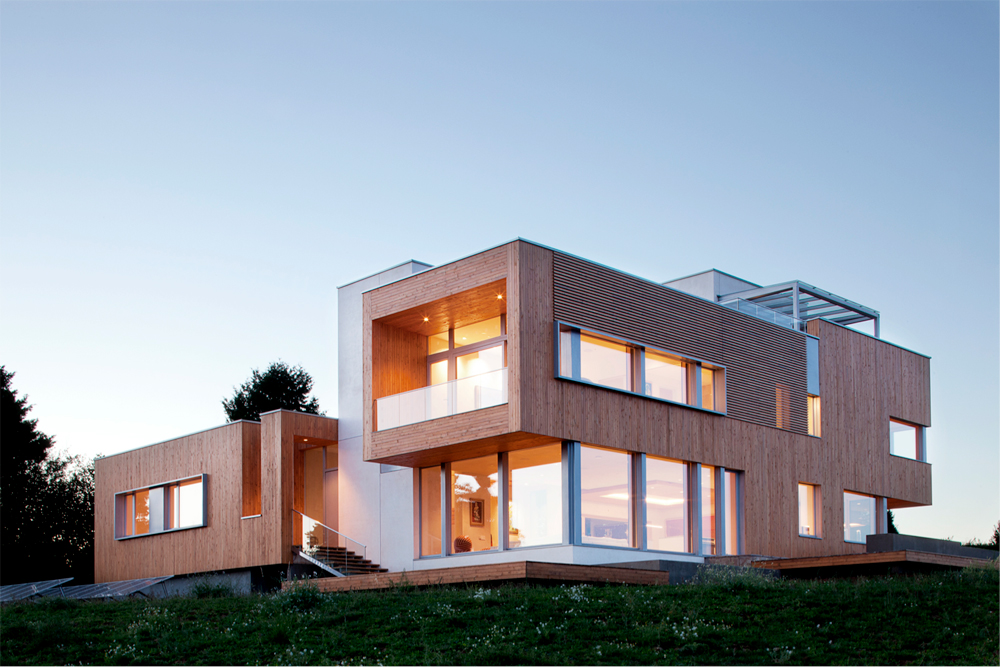
Designed by Holst Architecture and built by Hammer & Hand, the net positive energy Karuna House is a great example of the fusion of high design and high performance building, recently winning a 2030 Challenge Award from the Portland chapter of the American Institute of Architects.
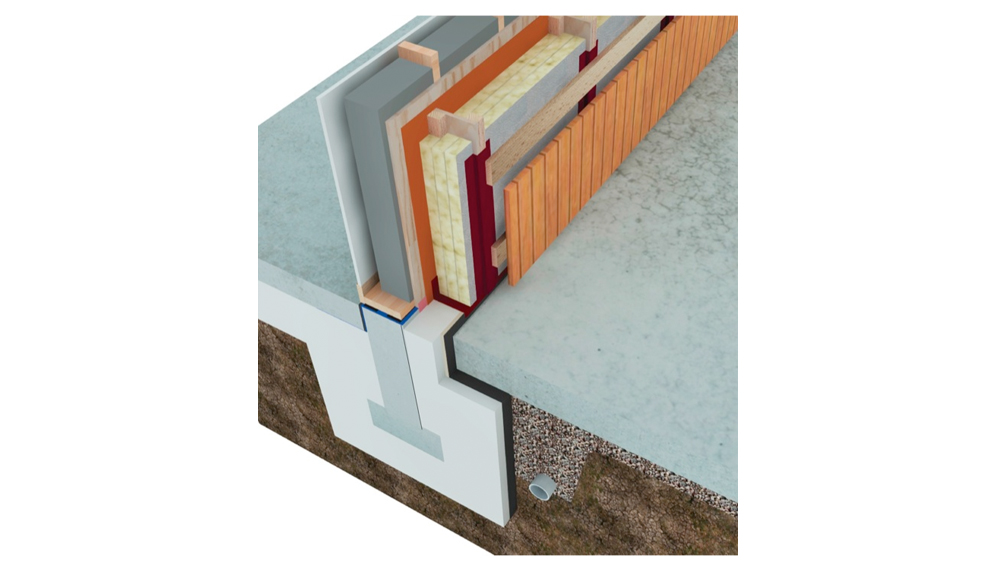
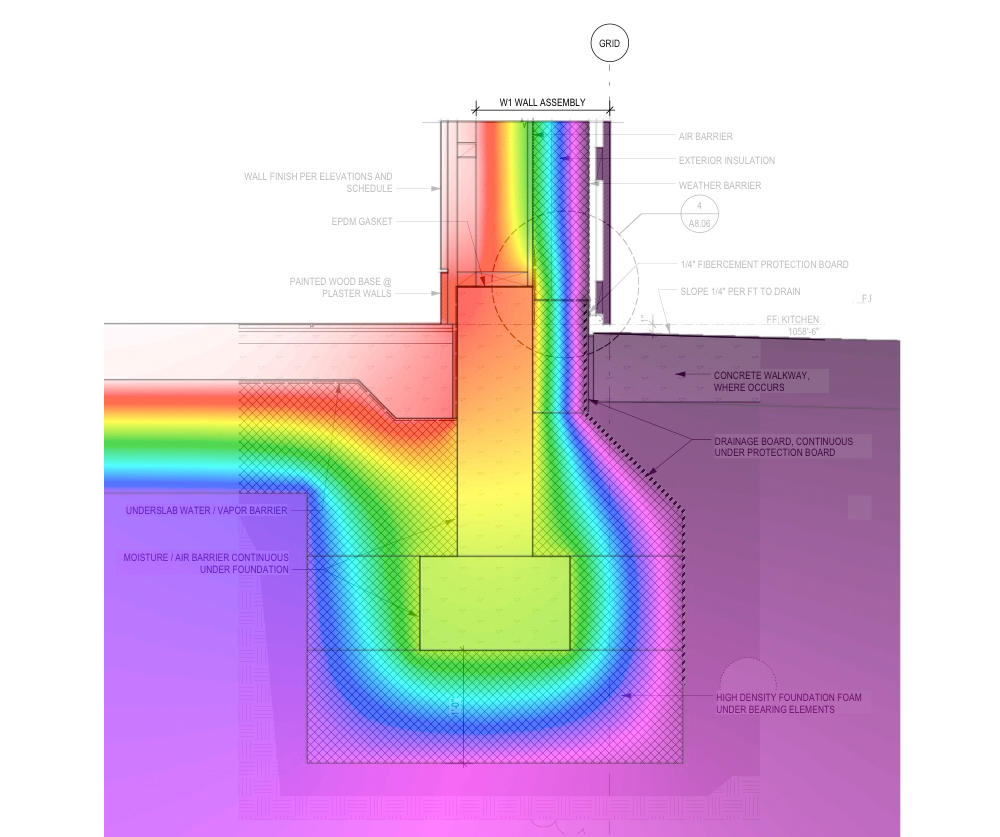
Like any high performance building, it starts with a super-insulated connection to the ground. We built the house on a thick layer of EPS geofoam to achieve a very-cozy insulative value of R-56 in assembly. The THERM image below shows that the cool of the earth and the warmth of the house are being kept where they belong, separate.
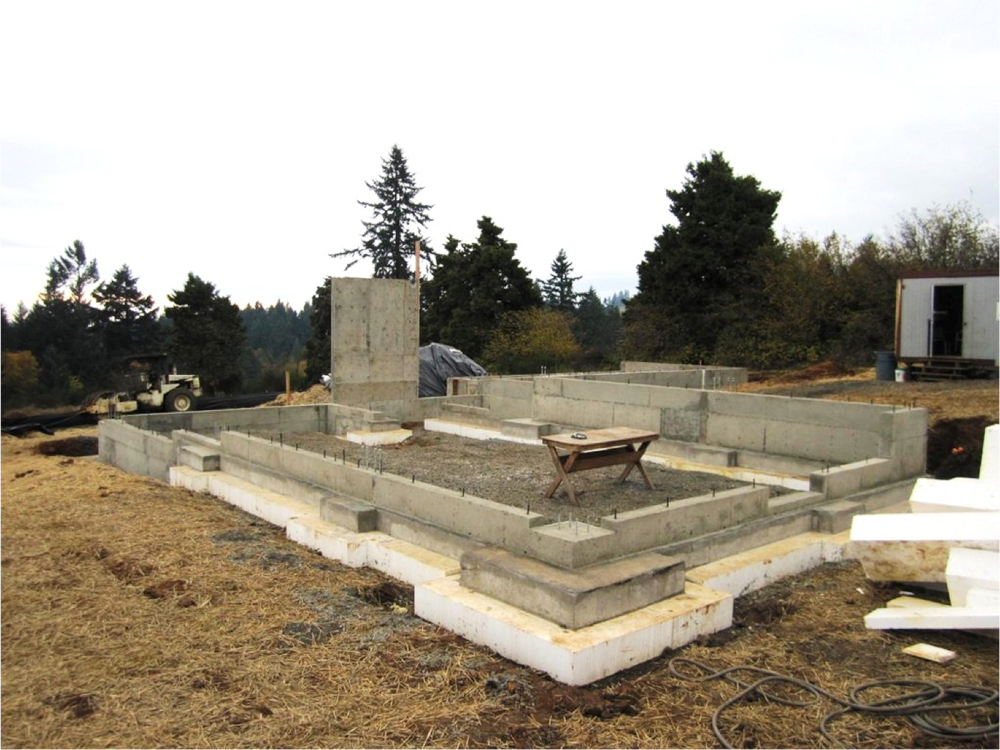
And here’s a shot of the foundation under construction.
The wall assembly at Karuna House builds upon this high performance foundation, achieving a heroic near R-60 insulative value. (The home’s elevation, combined with some of its high design moves, required this R-value in order to achieve Passive House performance.)
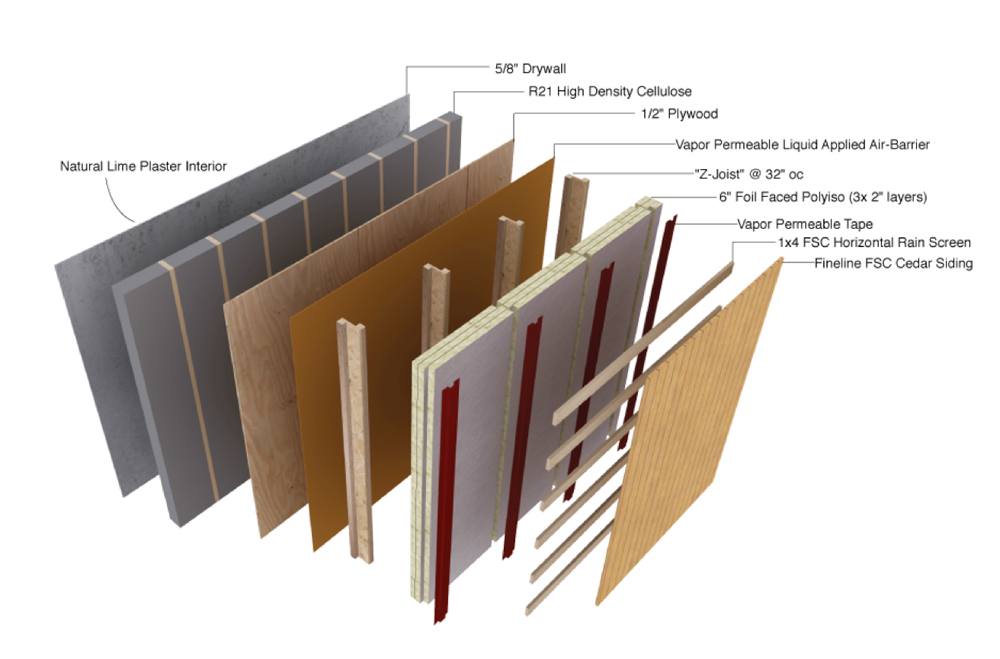
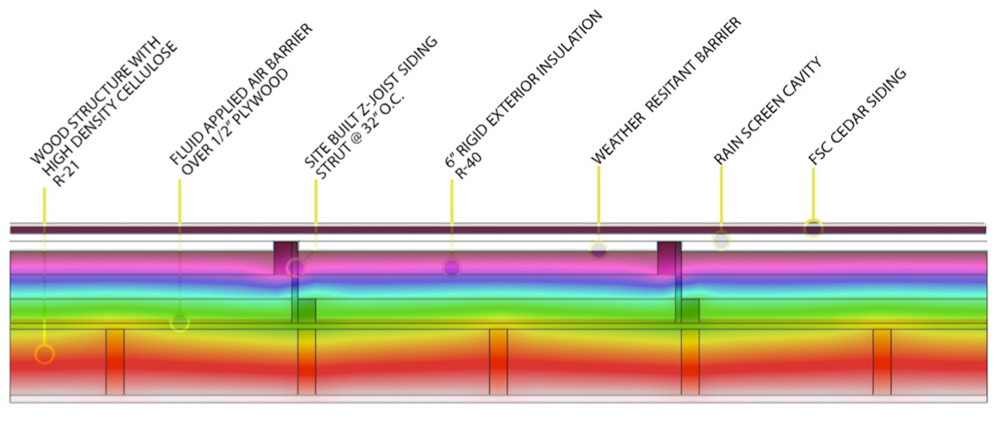
A thick layer of high density cellulose in a stud wall provides the assembly’s interior layer of insulation. Plywood sheathing coated with Prosoco R-Guard creates a vapor permeable air barrier. 6 inches of polyiso foam insulation wraps the home in a monolithic layer of exterior insulation. And a rain screen of FSC-certified® cedar siding provides protection from bulk water intrusion. This THERM diagram of the assembly in plan view shows the wall’s thermal performance:
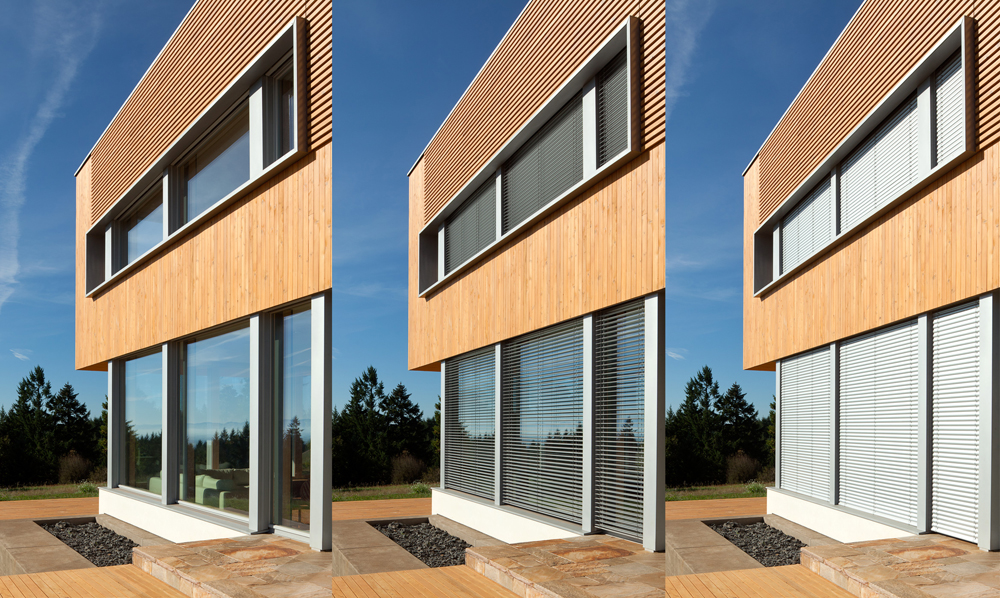
High performance windows and doors are key to any Passive House. At Karuna House we used Optiwin triple-glazed windows with an insulative value of R-8. Coupled with our passive solar design for the project, the windows are energy positive, meaning that the solar gain that enters the home through the windows offsets any thermal loss that escapes through them. During the shoulder seasons when the angle of the sun is low enough to create lots of solar gain but outside temperatures are still fairly high, the gain from these windows can actually be too high. So external shades provide important passive cooling in peak times:
Karuna House’s high performance building envelope drives energy loads so low that relatively small, super-efficient mechanical equipment can provide all the heating, cooling, and ventilation needs of the structure. A single Daiken Altherma air-to-water heat pump, for example, heats the entire 3,500sf house as well as provides its domestic hot water. Here Jonathan Cohen of Imagine Energy poses next to the relatively tiny unit:

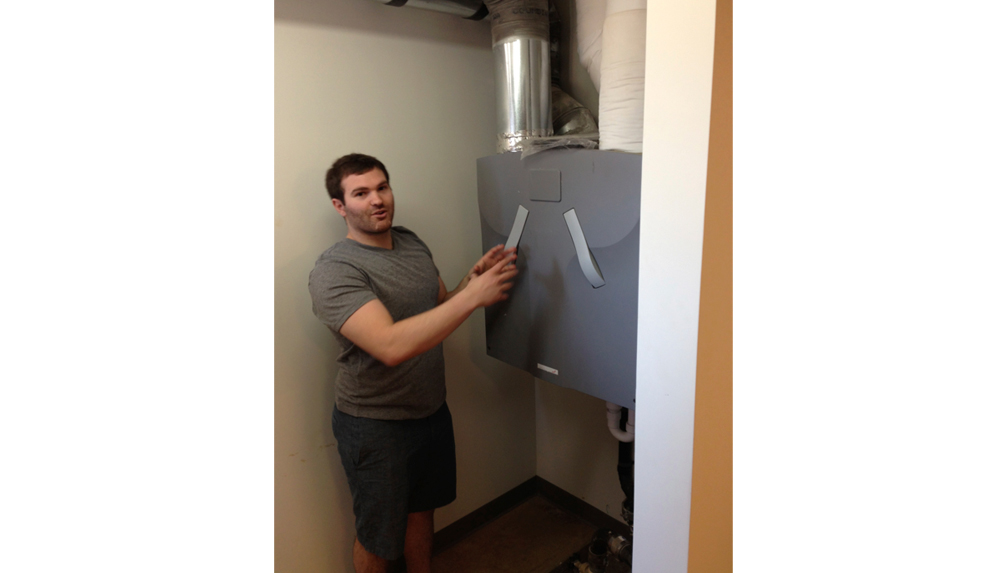
And here Skylar Swinford of Hammer & Hand poses next to the Zehnder Heat Recovery Ventilator that provides a constant flow of oxygen-rich fresh air while exhausting stale air. A super-efficient heat exchanger captures the thermal energy from the exhaust air and transfers it into incoming fresh air without the two airstreams ever mixing.
The upshot of all these strategies is some simple math at Karuna House:
Passive House + Solar PV = Net Positive Energy
And the same can be true for countless Passive House projects worldwide, each with its own distinct approach and construction detailing, but each with the high building performance necessary to make net zero energy building possible. For more examples of Passive House construction details in the Pacific Northwest, check out H&H president Sam Hagerman’s post “4 Years, 5 Walls, 6 Projects: Passive House Lessons from the Northwest”.
Now back to that 2,000 sf net zero energy house in Seattle or Portland…
STOMPING ON HEATING & COOLING LOAD GIVES US A HEAD START TO NET ZERO
Earlier in this post we saw that for a 2,000 sf house in Seattle or Portland to reach net zero energy with a 6.6 kW solar PV array we would need to reduce the energy consumed by the house by about 75%. Here’s that graph:
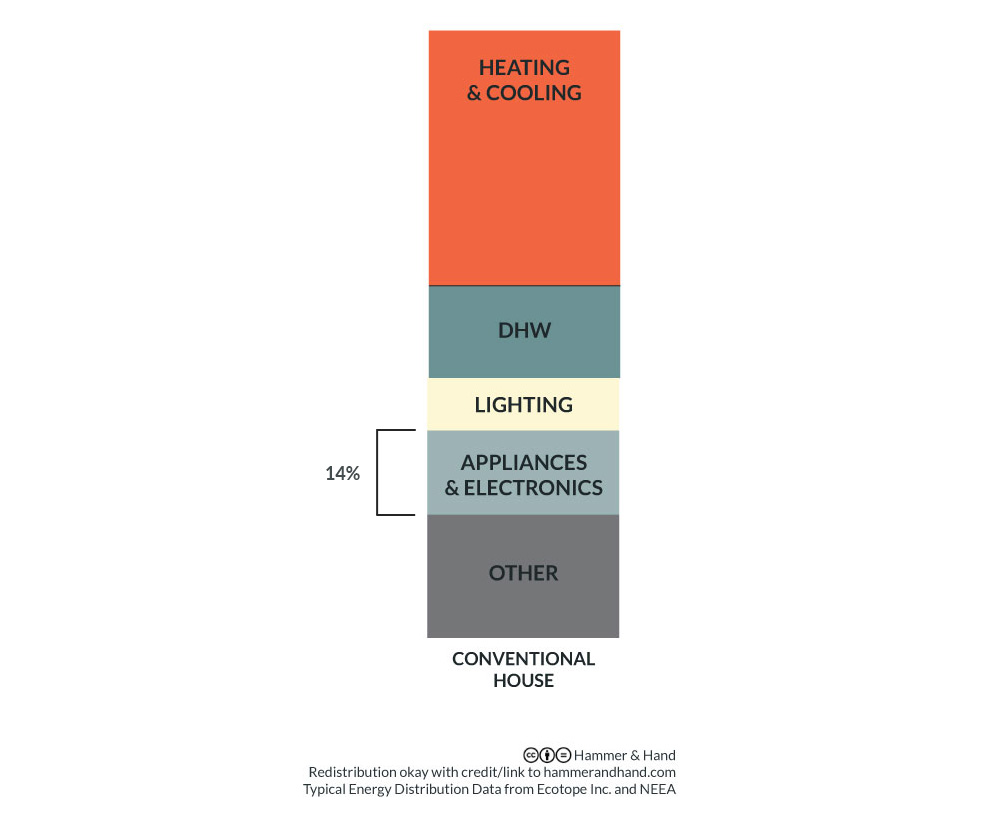
To understand how to get there, let’s unpack energy consumption of single family homes in the Northwest. According to a report by Ecotope for the Northwest Energy Efficiency Alliance, houses in our region consume energy as shown in the left hand column below. Fully 42% of household energy consumption goes to heating and cooling.
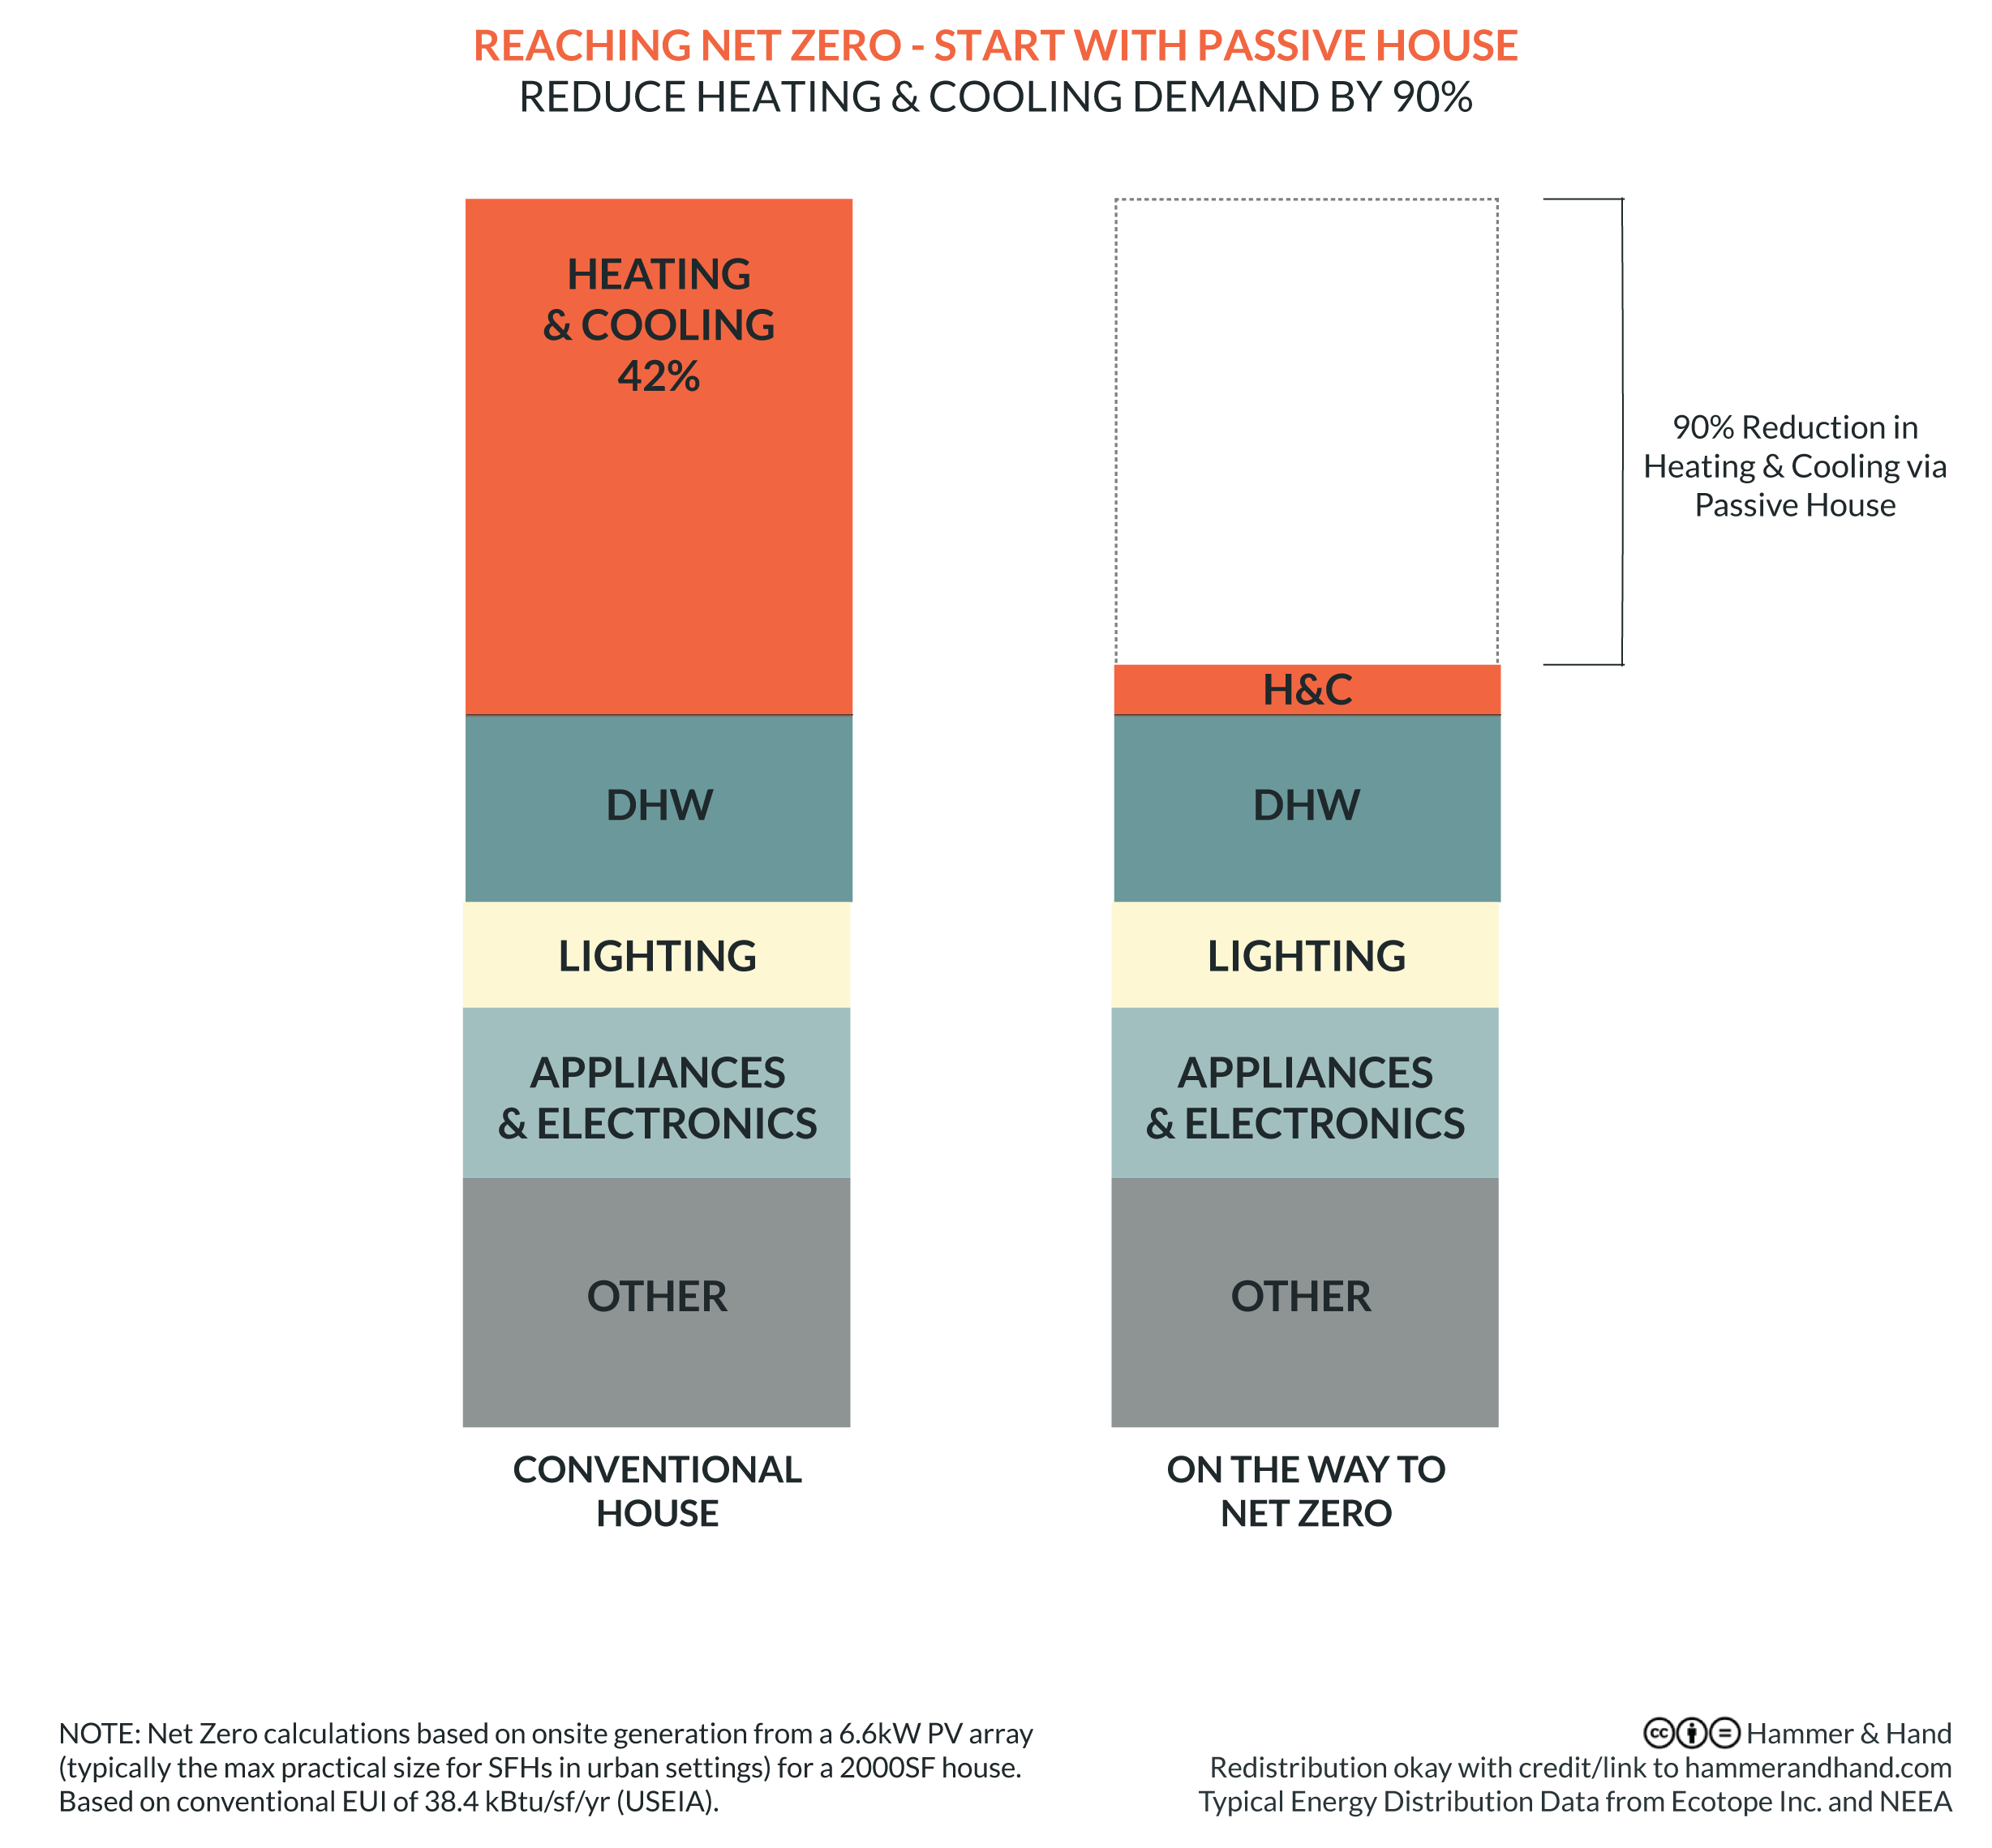
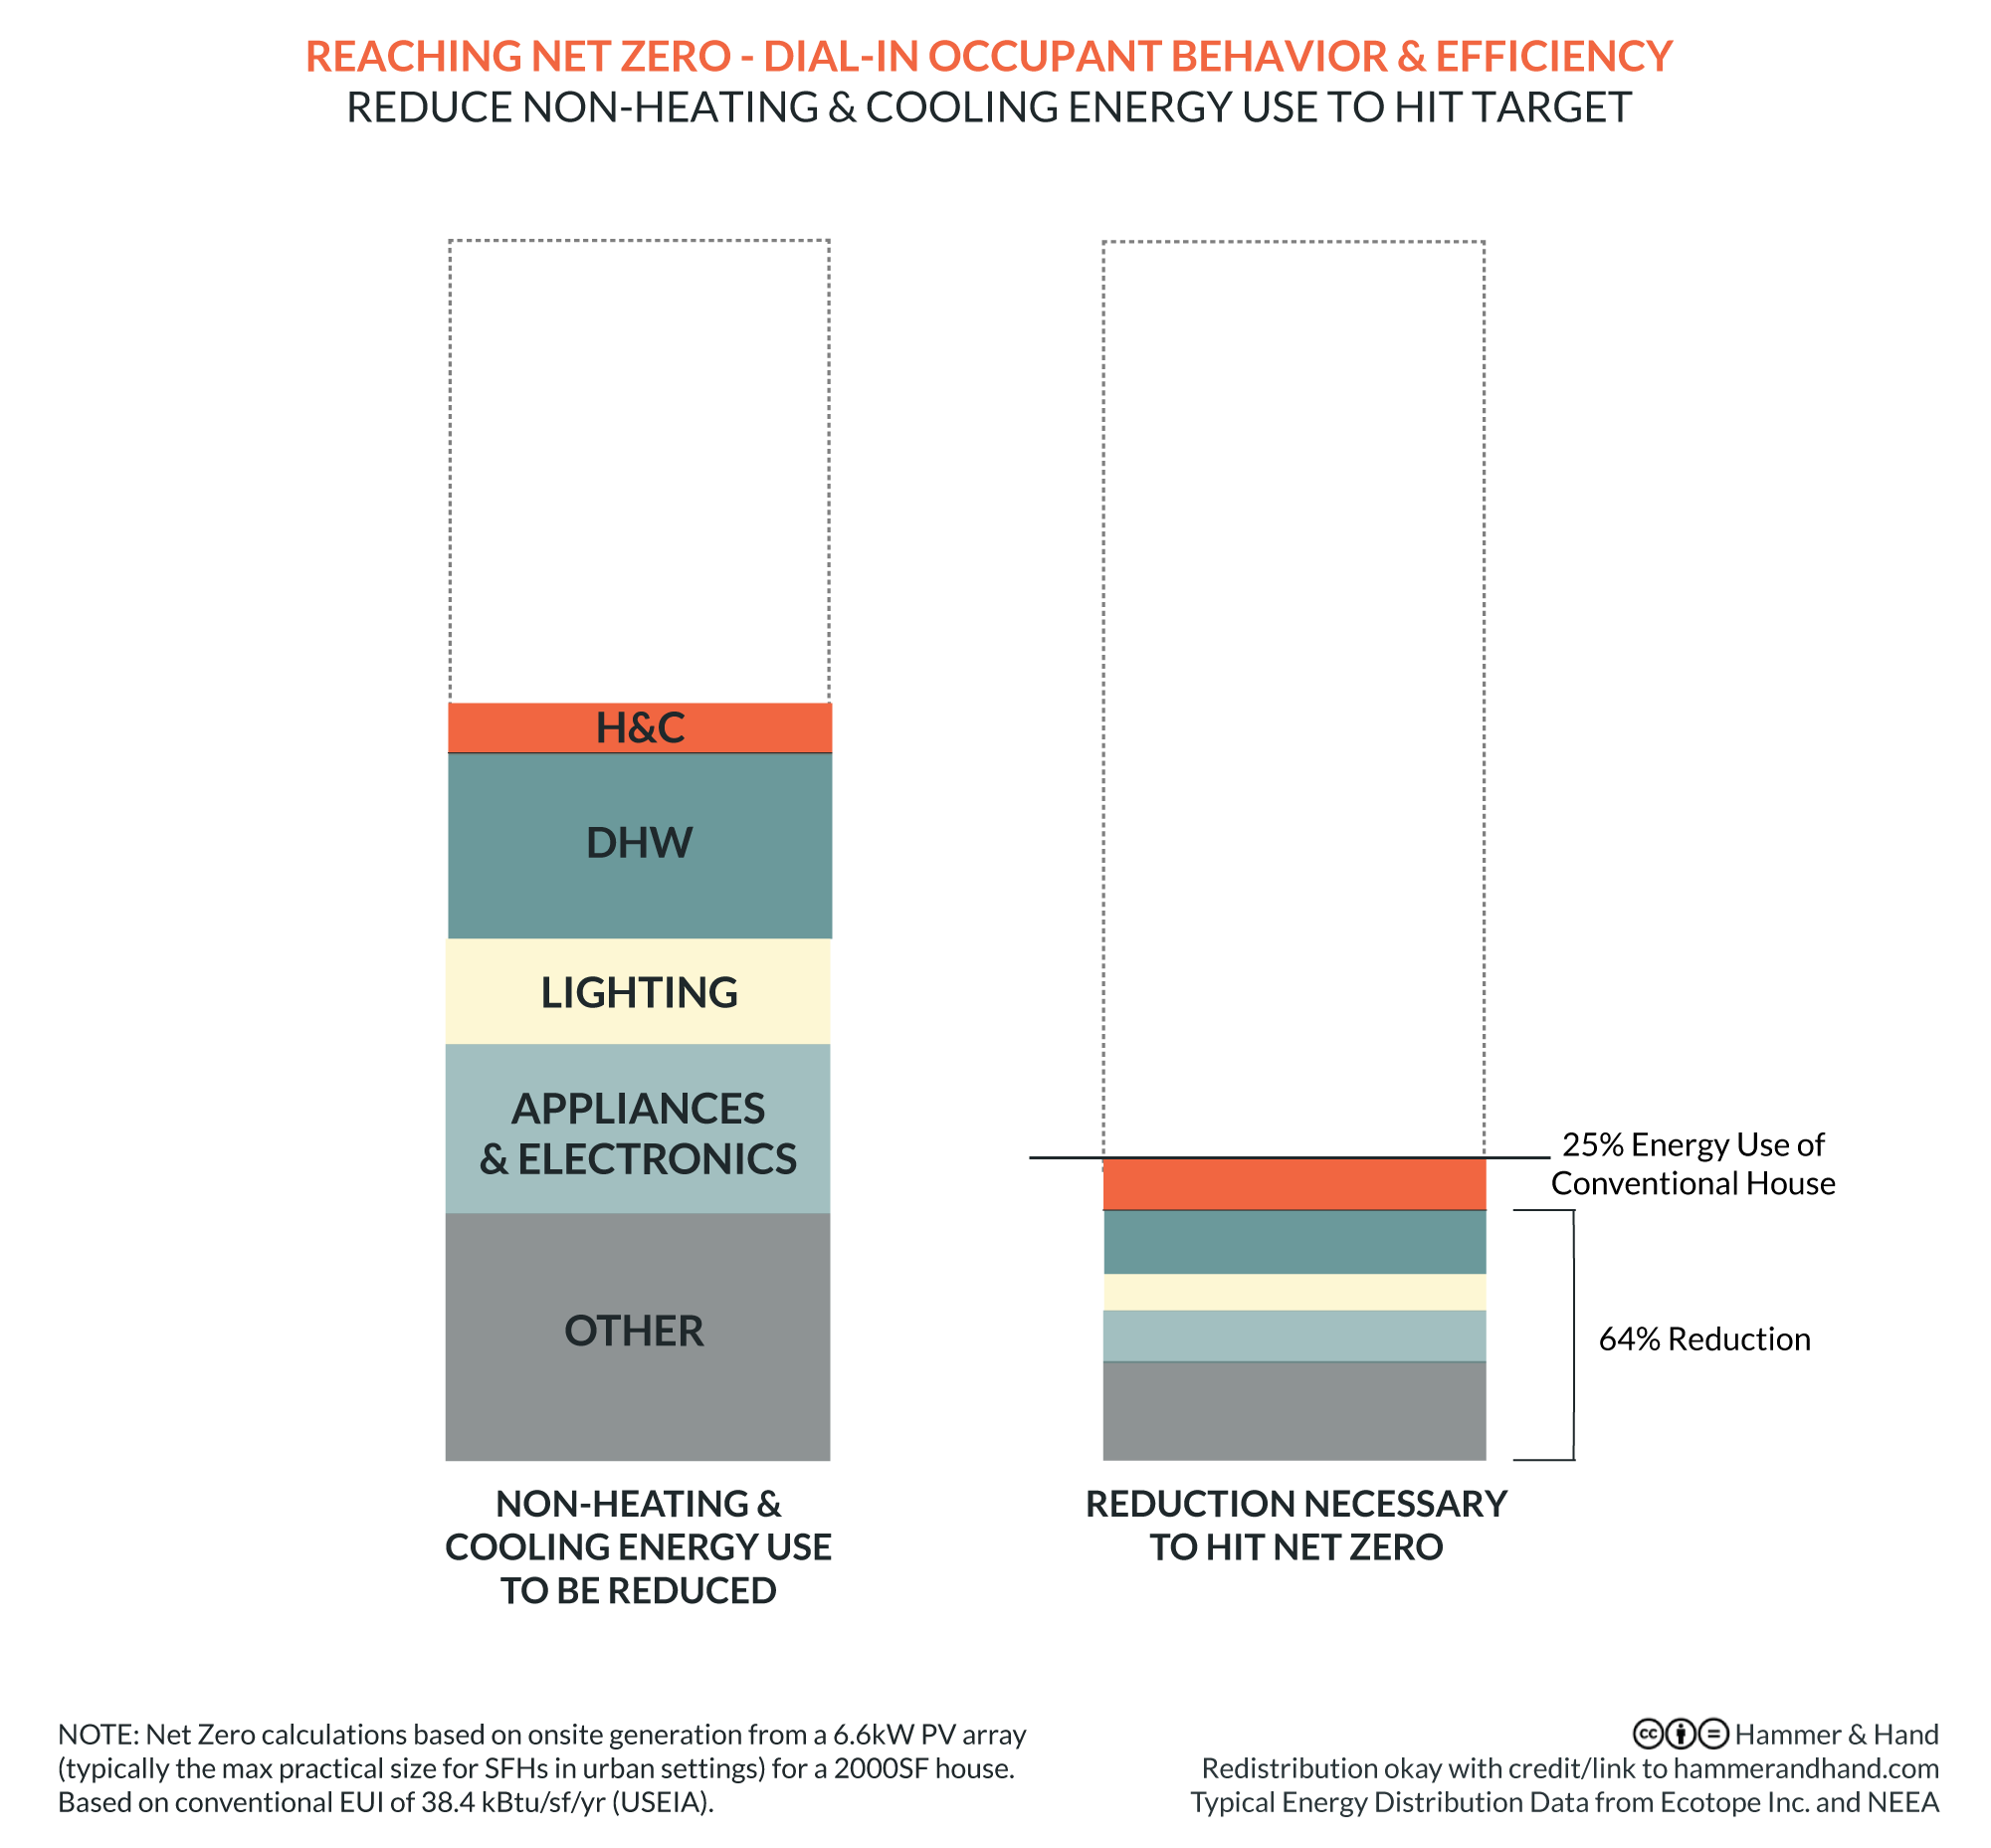
That’s great news, because Passive House can stomp down on this heating and cooling demand and reduce it by fully 90%. If we reduce this segment of the consumption column by 90% (as seen in the right hand column) then we’re reducing overall energy consumed by the building by 37.8% (90% of 42%) right out of the gate. Without any other energy reducing measures, Passive House already gets us halfway to our 75% goal.
How do we get the rest of the way to 75%? User behavior, improved domestic hot water systems, better lighting, super-efficient appliances, and better electronics.
It’s sometimes said that there’s no such thing as a net zero energy building, just net zero energy occupants, and this chart from the Passivhaus Institut illustrates why:
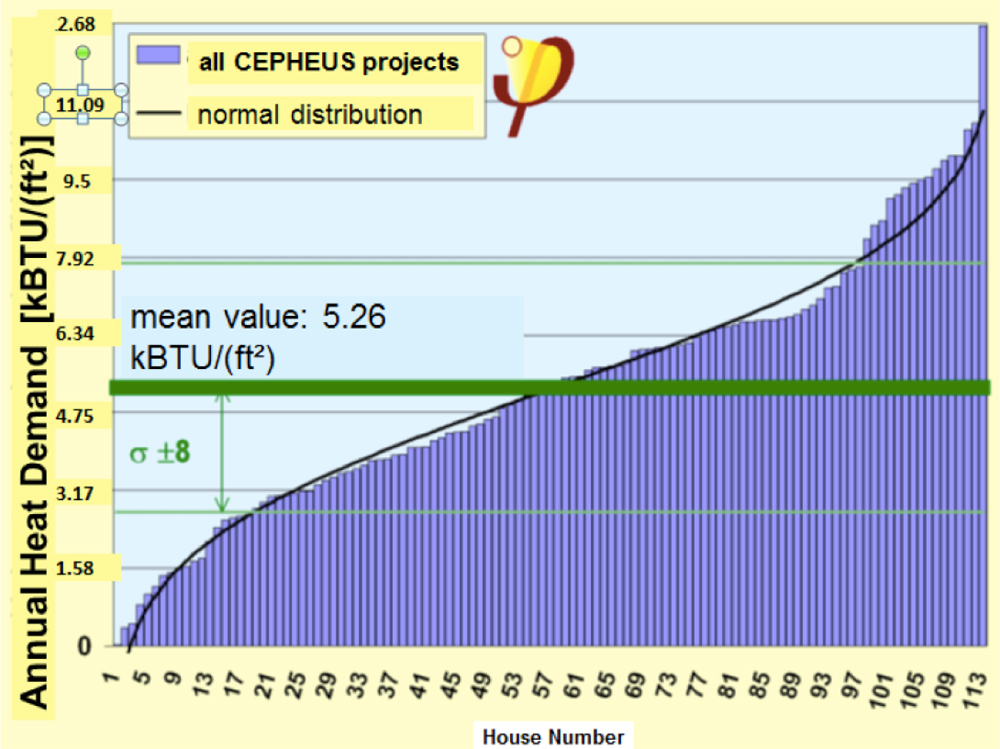
Each vertical blue bar represents a distinct Passive House unit and its energy used for heating. On the left hand side we see the energy misers who use almost no energy at all. On the right we see the energy hogs who use an order of magnitude more. The difference is fairly staggering, really, and illustrates how important occupant behavior is when we’re up against something like a 75% energy reduction imperative. That said, it’s handy to view this in perspective:
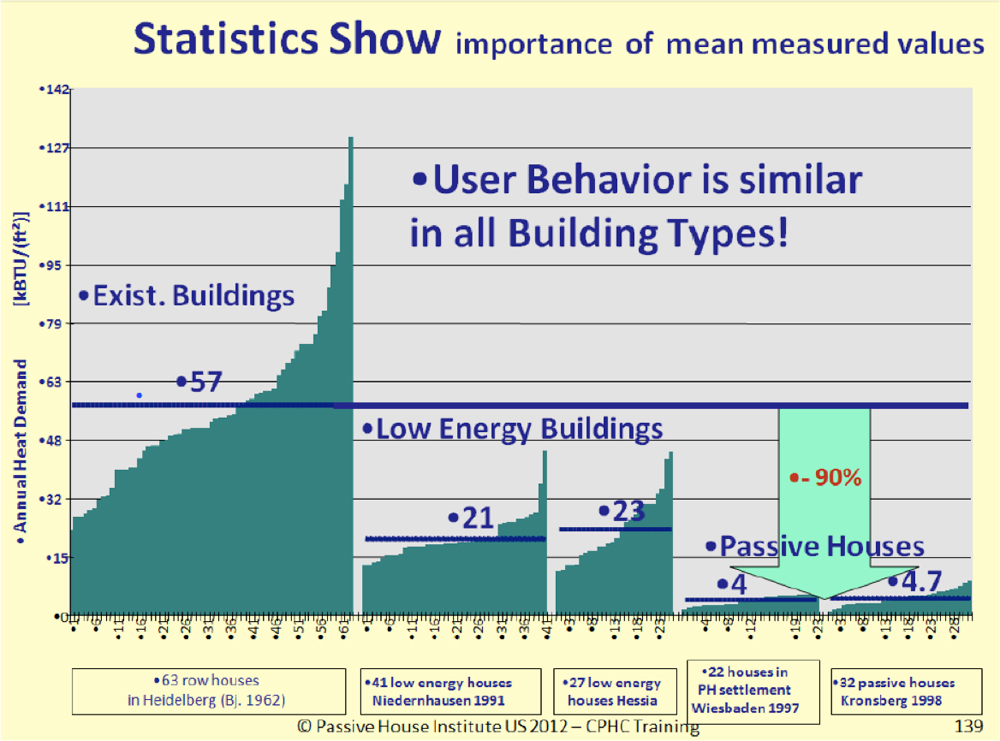
On the right we see a couple versions of our Passive House bar graph, but with analogous graphs of “existing buildings” and “low energy buildings” (perhaps analogous to ENERGY STAR) added. We see the same basic shape and distribution of energy misers and energy hogs in all building types. But what is interesting is that the Passive House bar graphs had to be squashed very flat and tiny just to accommodate the new graphs for “existing buildings” and “low energy buildings” in scale. The comparison in energy use is pretty breathtaking. And close examination shows that the energy hogs in Passive House buildings use less energy for heating than the energy misers in the “low energy buildings.” So user behavior matters, but so does building context.
Domestic hot water is the next big section of the household energy consumption column that we need to target, and the key is a systems-based approach to super-efficient production and distribution.
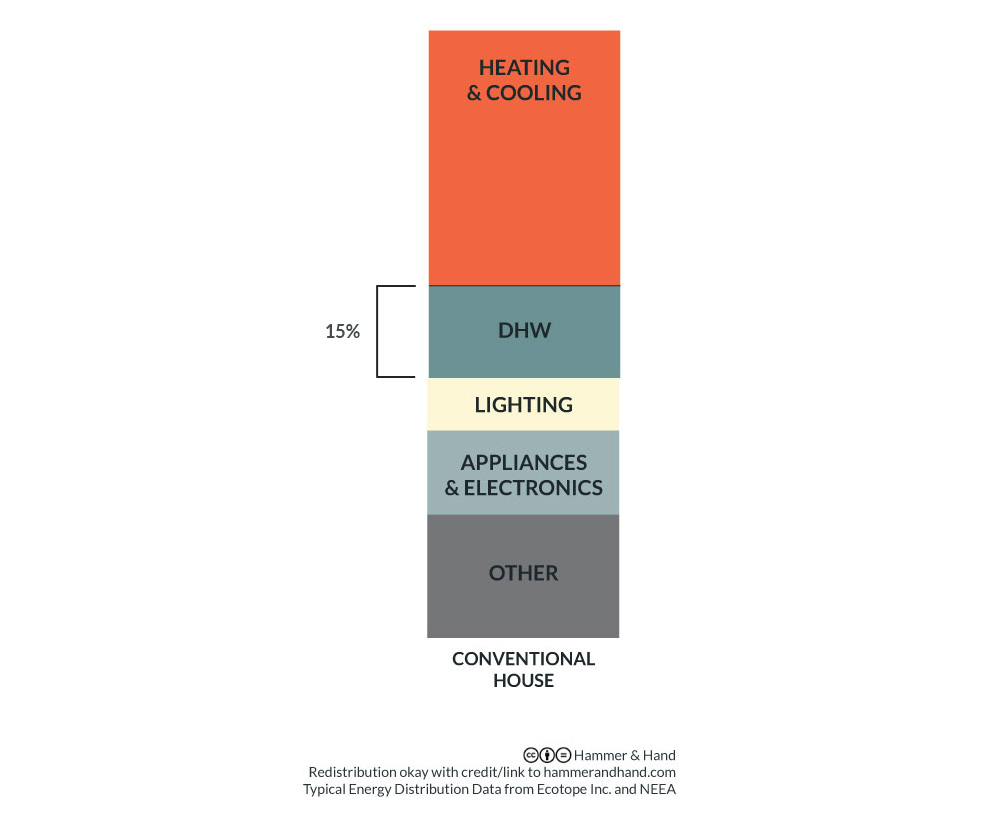 Some new products, like the Sanden heat pump hot water heater with its climate-friendly CO2 refrigerant, are boasting coefficients of performance (COPs) of 3.0 and higher, meaning that they are three times as efficient as a conventional unit. Couple a unit like this with well laid-out on-demand circulating system and you can make a major dent in that 15% of household energy used for DHW.
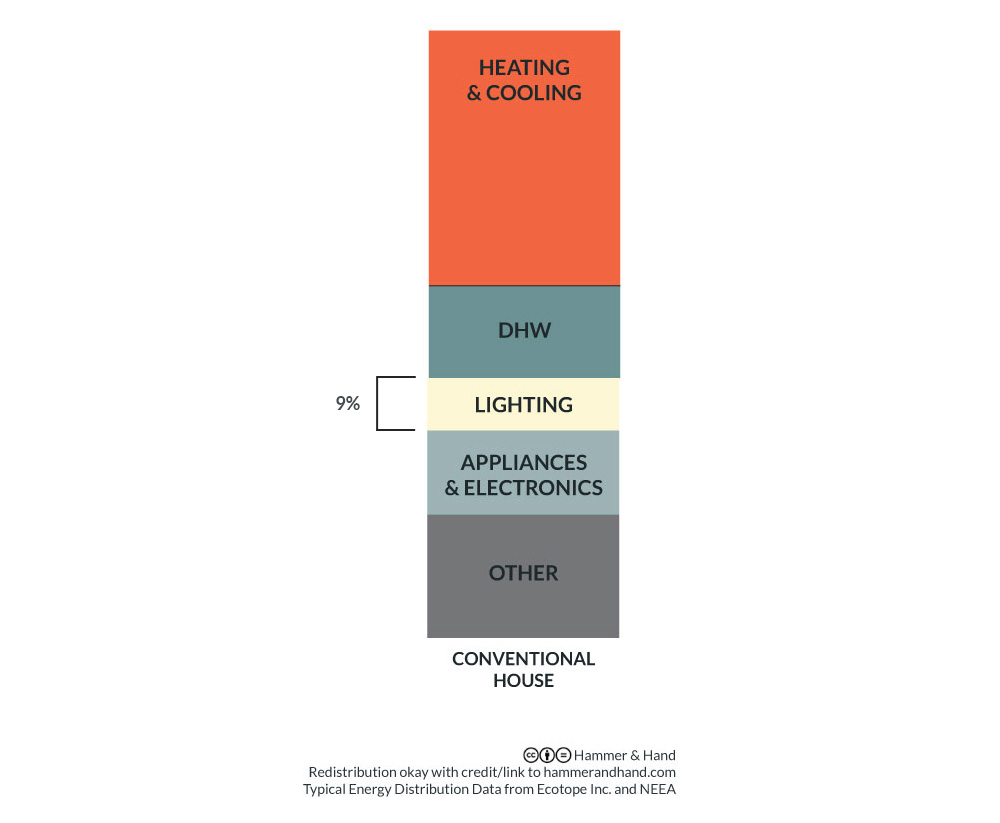
The same is true for lighting. By combining LED bulbs with smart daylighting strategies, the 9% of energy used for lighting in conventional homes can be slashed to very low levels.
 Which brings us to the 14% of household energy going to appliances and electronics.
 I won’t dive into super-efficient appliances or smart electronics choices here, but by using state-of-the-art washers and other appliances we can make major gains in energy consumed, shaving away much of this 14% section of the consumption column.
Reducing energy consumption by 75% ain’t easy. It is doable, however. But only if you squash heating and cooling energy use by 90% first through high performance building strategy like Passive House. Once you’ve done that it becomes feasible to get the rest of the way there through a combination of user behavior and better domestic hot water, lighting, and appliances and electronics. In the typical case we’ve illustrated here, non-heating and cooling energy use will need to reduce by 64% in order to hit the overall 75% reduction target:
Performance matters. But so does the experience of living in our buildings. The final post of this series (Part III), will show that the high performance building approach to net zero/positive energy building also enables builders to deliver on arguably our most important goal: bringing health and happiness to building occupants.
Save
Back to Field Notes