This post is part two of a two-part series that began with, “Who’s Afraid of the Big, Bad Jevons Paradox? (Climate Hope Part I)”.
That post began with a discussion of the climate crisis and the risk of nonlinear (i.e. exponential) change, went on to a refutation of the Jevons Paradox, and ended with the rhetorical questions: what’s to stop fossil fuel companies from digging it all up, drilling it all, and burning it all? And if that happens, then what’s the point of renewable energy and energy efficient buildings? Aren’t we just delaying the inevitable?
Are we doomed?
Maybe, but I don’t think so. The reason starts with this image, One Thousand and One Days in the Life of a Turkey, from Nassim Nicholas Taleb’s book, The Black Swan :
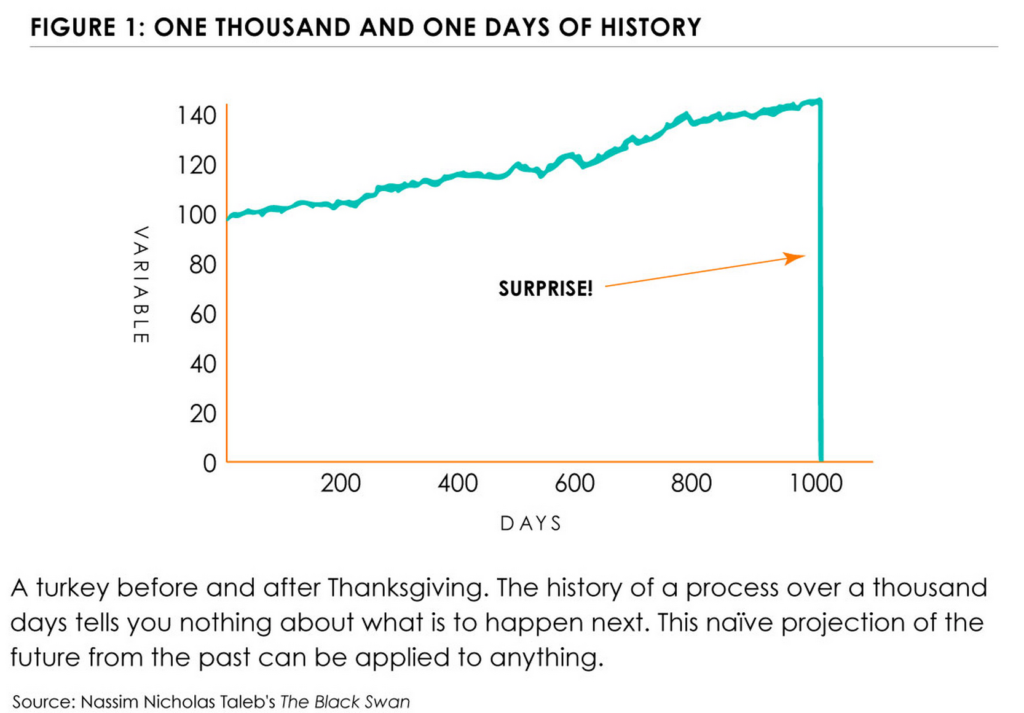
This graph illustrates the impact of confirmation bias on our thinking. On day zero the turkey is born and begins his existence on the farm. He’s got a good thing going: clean water, good food, a nice free range to run around in. Every morning he wakes up with a pretty good idea of what’s in store that day. Yes, he has little ups and downs, but generally speaking he has a good life. And with every passing day he becomes more and more sure that he understands the boundaries of his existence. Each day confirms his assumptions about his life. What could go wrong?
Thanksgiving, of course. On day 1,001 the axe comes down, the feathers are plucked, and the turkey is served for dinner.
It is that system-disrupting event – an event that the turkey was unable to see coming – that is called a “Black Swan event.” Taleb argues in his book that many of the key turning points in human history can be described by the graph above. September 11th, for example. Or the fall of the Berlin Wall and the fall of the Soviet Union. The graph can describe ecosystem collapse, where the stresses on an ecosystem are absorbed over time until finally a tipping point is hit and everything falls apart, seemingly overnight. It also can describe social change, like the election of the first black president or the coming of marriage equality. The Black Swan event can describe positive or negative events, but in all cases it describes an event that people were either unable or unwilling to see coming that ends up completely changing an established system.
Shortly after I read The Black Swan I came across this image on the web, and I think it looks a lot like a Black Swan:
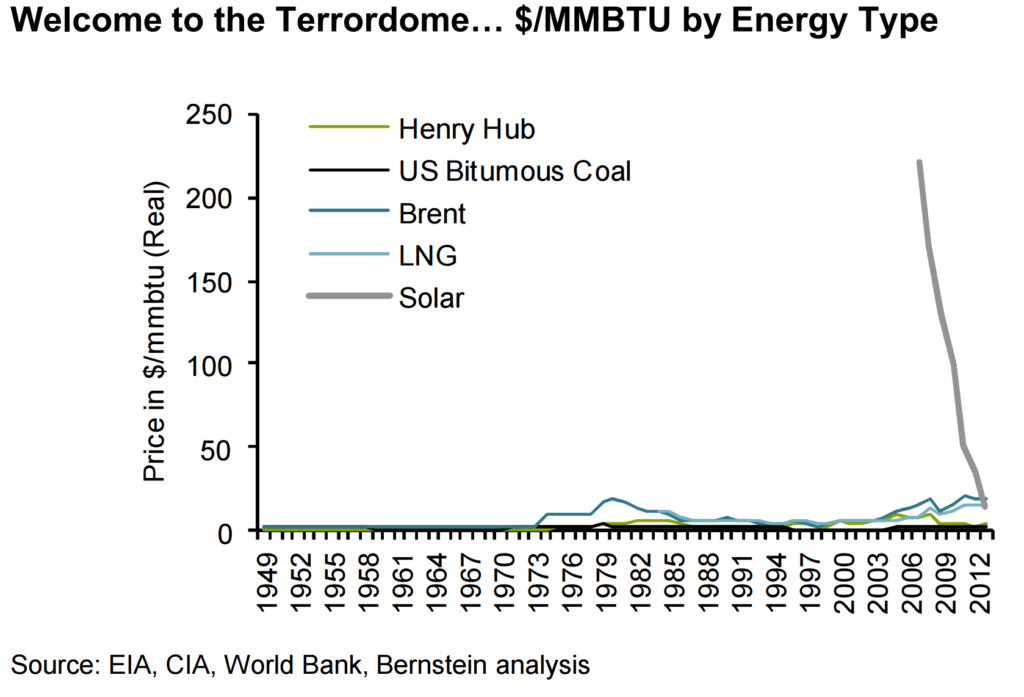
The graph depicts the cost of energy in emerging Asian markets. Along the bottom we see the wavering lines of the status quo: the cost of energy provided by oil, gas, LNG, and coal. Then, dropping out of nowhere comes solar energy, suddenly challenging fossil fuels on price, without subsidy. Before the late 2000s solar didn’t even register on this graph, then it swoops in and threatens market disruption. This graph was published by the investment firm Sanford Bernstein in a report to their energy investors. Sanford Bernstein manages $454 billion in assets, so these are sober folks. But they title the graph “Welcome to the Terrordome” because they know something big is afoot here.
In their report, Sanford Bernstein’s analysts say that they expect the downward trend of solar energy price to continue to fall because solar energy is a technology, not a fuel. And innovation drives technology price down.
Moore’s Law
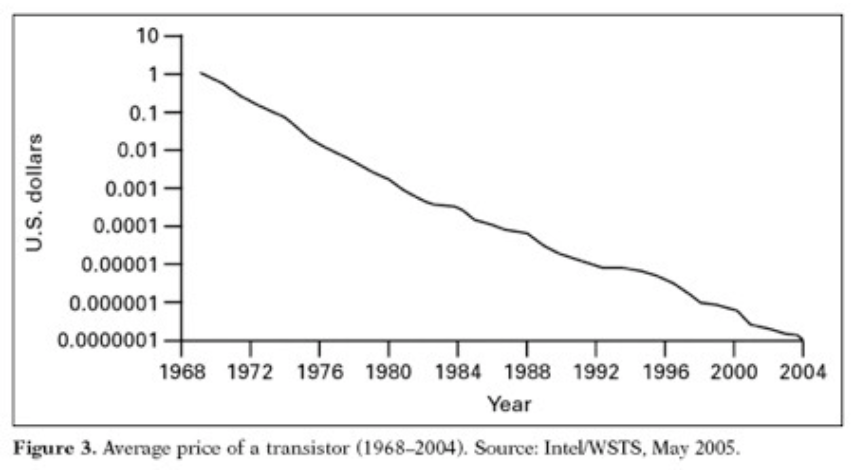
SOURCE: Intel/WSTS
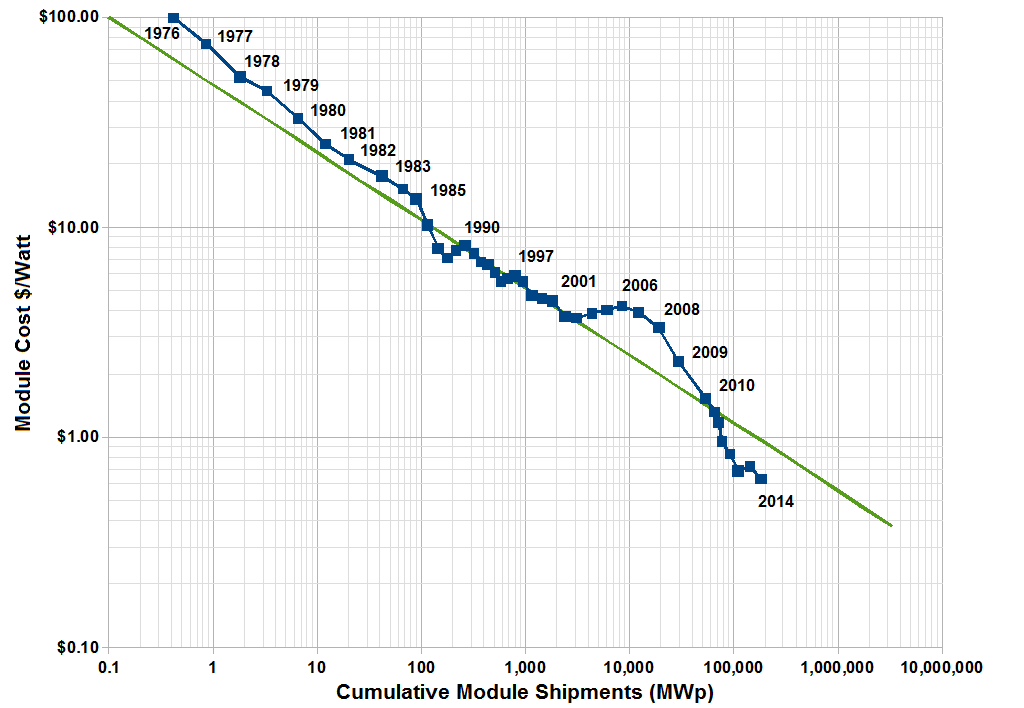
Swanson’s Law
SOURCE: Wikipedia
You’ve probably heard of Moore’s Law in the computer chip industry. It says that every two years or so the number of transistors that fit on a chip will double, and it’s this doubling that has been responsible for the exponential increase in computing power over the past several decades as well as the precipitous fall in the price of that computing power. In the solar energy space there is a very similar law, called Swanson’s Law, also known as “learning curve law.” Swanson’s Law says that for every doubling of deployed solar capacity around the world we see a 20% reduction in the price of solar PV module.
This is what Swanson’s Law has done to the price of PV:
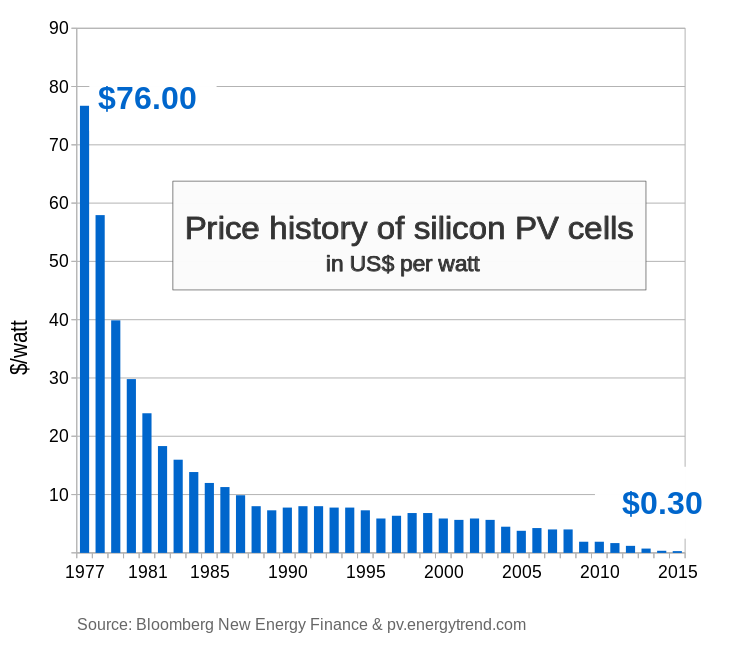
Between 1977 and 2015 the price of silicon PV cells dropped by an astounding 99.6%, from $76.00 per watt to just $0.30 per watt. And that downward trend continues. The graph (from Lazard https://www.lazard.com/media/1777/levelized_cost_of_energy_-_version_80.pdf) below right shows the levelized cost of energy (LCOE) of solar for the past 5 years; LCOE includes not only the cost of the panels but also all the other costs that go into generating and distributing energy from a given source. Solar’s LCOE dropped by 78% in the past five years alone. Wind also dropped significantly: 58% during the save five year period. Wind’s downward trajectory is not quite a steep as solar, but wind has a head start on solar because it is already considerably cheaper at the utility scale.
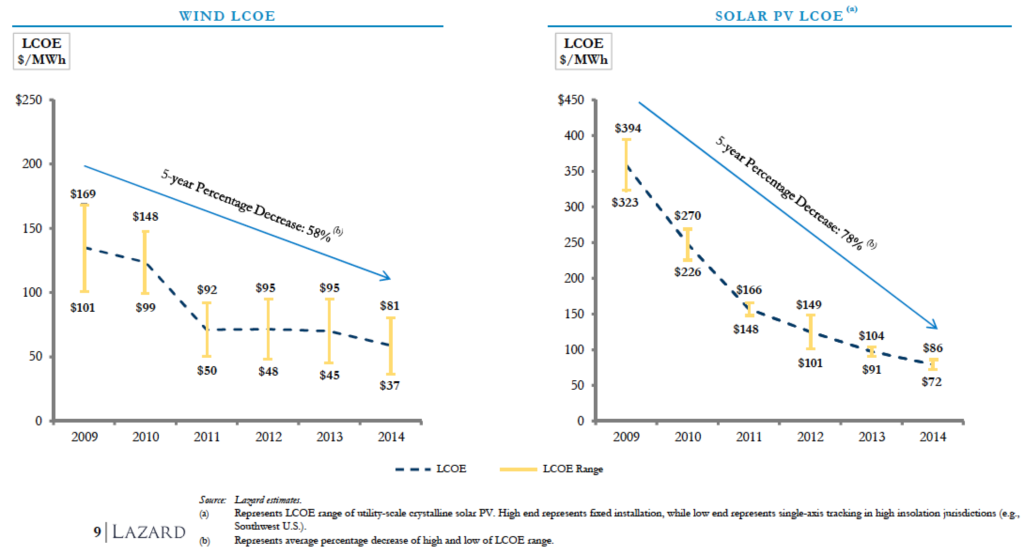
SOURCE: Lazard
Sanford Bernstein goes on to say that solar price will begin to drive fossil fuel price down, but that solar deployment will have to increase by 10x before that happens. This upends the traditional view of the relationship between fossil fuel price and renewable energy price: that renewables are subject to the vagaries of oil and coal, not the other way around. The traditional view says that when fossil fuels are expensive then renewables have a chance to compete, but when fossil fuels are cheap renewables don’t have a chance. But if Sanford Bernstein, Bloomberg New Energy Finance, and others are right, this relationship is about to be turned on its head. Renewables will begin driving fossil fuel price down. Solar energy isn’t it doing yet because it isn’t yet a large enough piece of the energy pie, but once deployment increases by 10x then that will change.
When you hear “deployment will have to increase by 10x,” you’d be forgiven for not holding your breath. But this is what is going on with solar deployment globally:
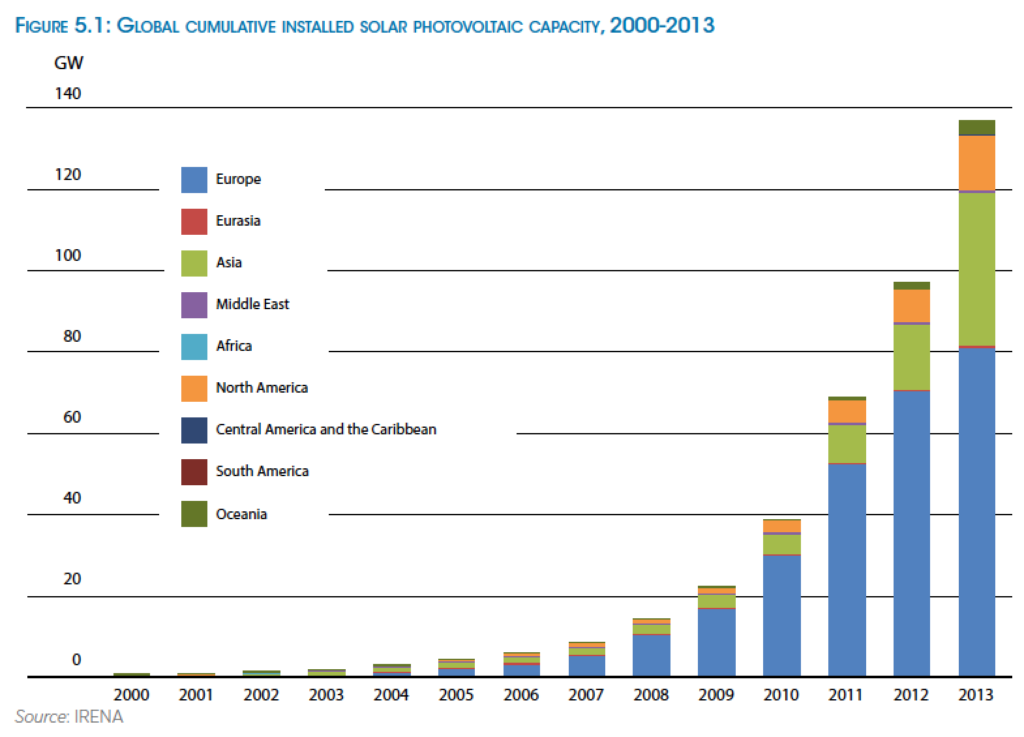
Absolutely exponential growth. Between 2011 and 2013 alone, global deployment doubled. At rates of increase like these it will only take a few years before we reach the 10x increase in solar deployment and the day comes when solar has the clout to drive down fossil fuel price.
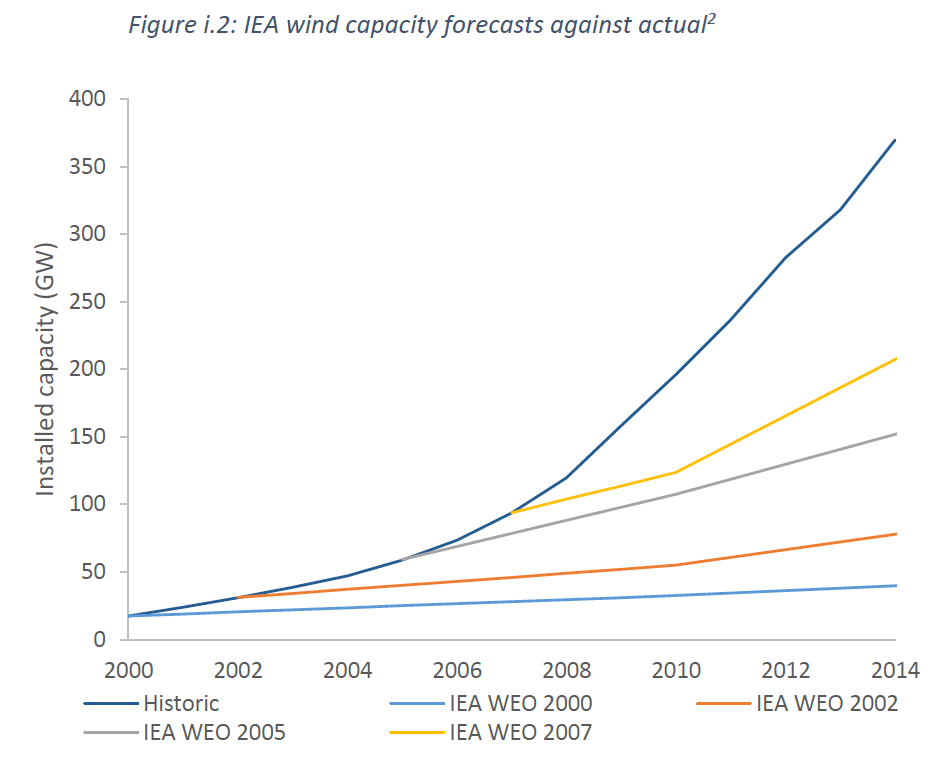
And in case you were wondering if we’re experiencing a Black Swan event, the graph below shows how unexpected all this was to the world’s top energy experts. The graph, which comes courtesy of Carbon Tracker Initiative, shows the exponential growth of solar deployment since 2000 (labeled “Historic”) and compares it with the projections of the International Energy Agency. If there was a single body on the planet that would represent “the world’s top energy experts” it would be the IEA. But as you can see, year after year their projections totally missed the mark.
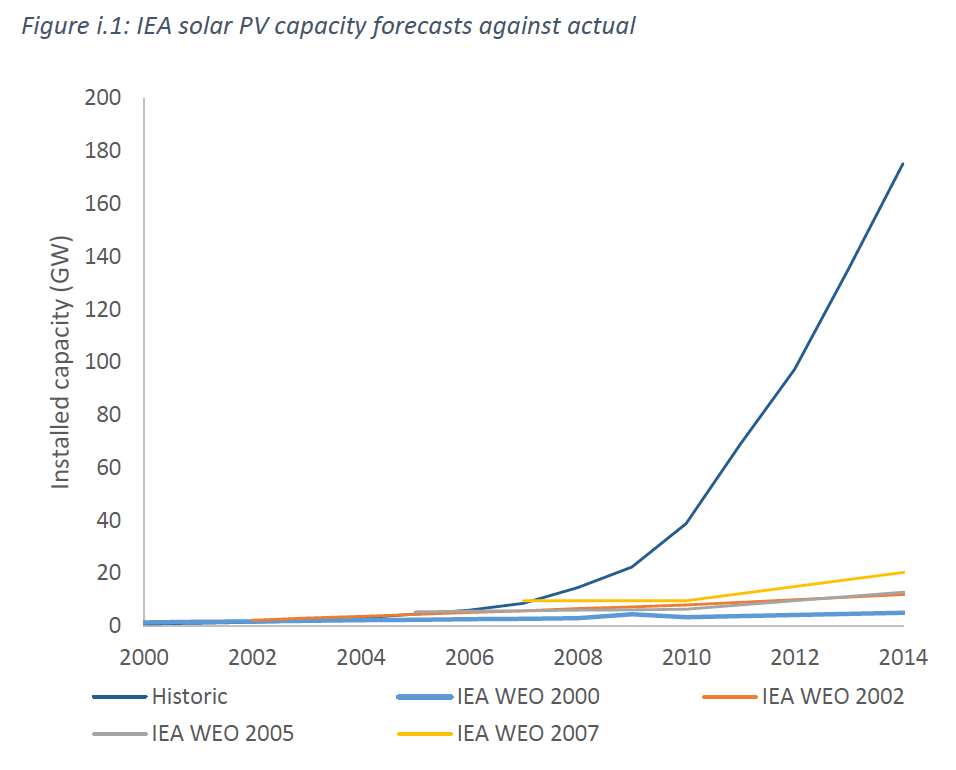 SOURCE: Carbon Tracker Initiative
What we see, every time, is IEA’s inability or unwillingness to accept that exponential change is occurring with solar energy. Each forecast by IEA instead projects steady, linear growth. Could this be the result of confirmation bias? Because linear change is what they know, are IEA’s experts simply unable to accept the possibility of nonlinear change?
They do a bit better with wind, but still grossly underestimate future growth:
SOURCE: Carbon Tracker Initiative
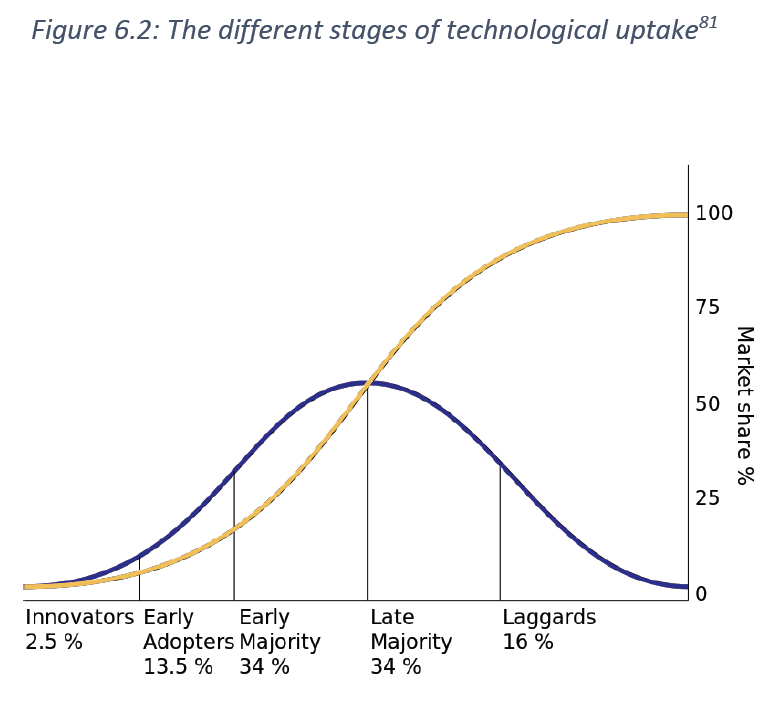
To be fair, it’s not their fault. This inability to predict system-disrupting change is the definition of the Black Swan event. And if you were an IEA analyst in 2005, sticking your neck out to predict a more than 25x increase in global solar deployment in the next 8 years might have seemed ridiculous, perhaps even career-ending. But for technologists, this kind of exponential rate of growth isn’t surprising at all. In fact, it’s what successful technologies do. They follow an S-curve characterized by exponential growth that tapers off as the technology reaches 100% market share.
SOURCE: Carbon Tracker Initiative
Whether you’re talking electrification, automobile use, radio ownership, refrigerators, or cell phones, successful technology uptake follows the S-curve.
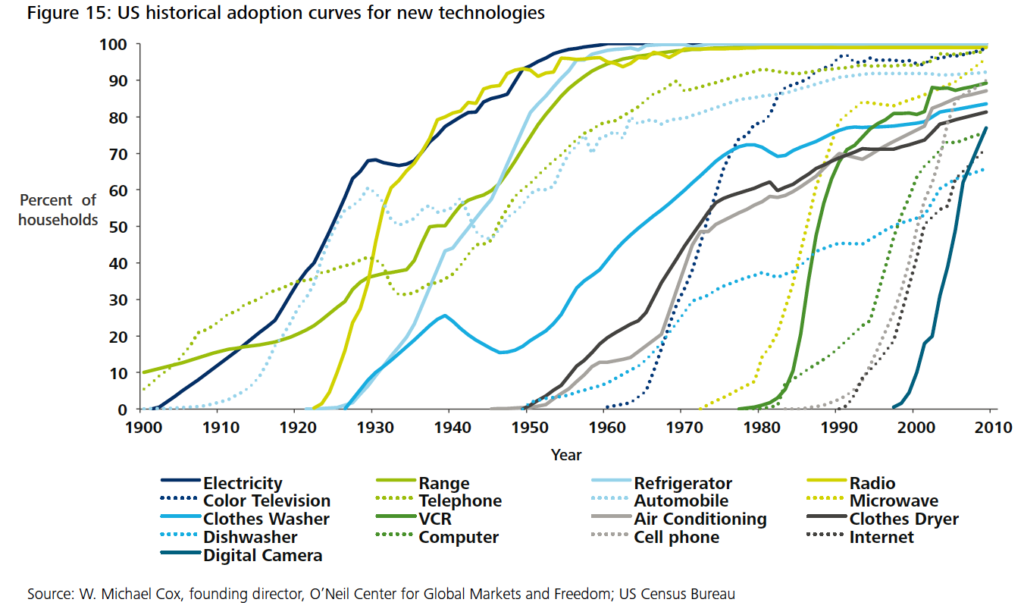
SOURCE: Deloitte Center for Energy Solutions
Given that solar and wind energy are technologies, not fuels, it shouldn’t be surprising that they appear to be on S-curve growth trajectories.
Okay, great. But so what? What’s to stop fossil fuel companies from just drilling and digging it all up anyway?
The answer is “stranded assets.”
A stranded asset for a fossil fuel company is a fossil fuel reserve that it cannot extract from the ground, either for moral imperative (society says “enough is enough”) or for market reasons: it simply doesn’t “pencil” to extract a given reserve at a given market price.
This chart below, prepared by CitiGPS (CitiBank’s research arm) and drawing on similar work by Carbon Tracker Initiative, shows an “oil cost curve:”
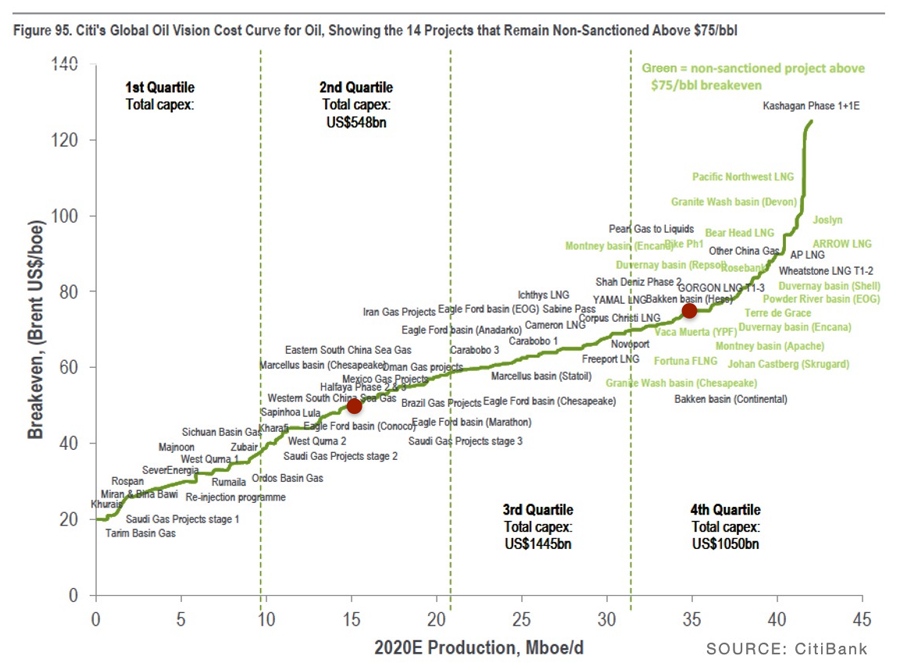
CitiGPS prepared this chart as part of its report, Energy Darwinism II: Why a Low Carbon future Doesn’t Have to Cost the Earth, that it released during the months leading up to the COP21 climate talks in Paris. The scatter plot of text shows various oil reserves around the globe. Those on the left are easy and cheap to extract. Those on the right are difficult and expensive to extract. The green line that runs through all of them shows the breakeven point for each reserve. The price of a barrel of oil has to be higher than that line to make any given reserve profitable for extraction. When CitiGPS released the report in mid-2015 the price of a barrel of oil was $75. At that price, all the reserves shown in green no longer pencil; they are too expensive to extract for that price. Today (late June 2016) the price of a barrel of oil has gone down to $48. At that price fully two-thirds of the global reserves shown on this chart do not pencil; they are simply to costly to extract at that price.
Now it bears mentioning that fossil fuel companies do not make their extraction decisions based on a single day’s price. But if these low prices were to persist – and there are plenty of analysts who believe they might – then lots of fossil fuels will be stranded in the ground.
And this is where things get exciting for those of us interested in “building as a climate action” through Passive House and net zero energy building. As we deliver super-efficient buildings and help make the built environment more energy efficient, we are creating a more energy efficient economy and are therefore reducing demand for conventional energy. All things equal, that means we are pulling that red dot down the green line of the fossil fuel cost curve and helping to strand fossil fuels in the ground.
Likewise, when we put solar panels on the roofs of our net zero or net positive energy buildings we are playing a part in Swanson’s Law, driving solar energy price down and increasing the market share of that solar energy. This reduces demand for fossil fuels, and, all things equal, pulls that red dot down the green line, stranding fossil fuels in the ground.
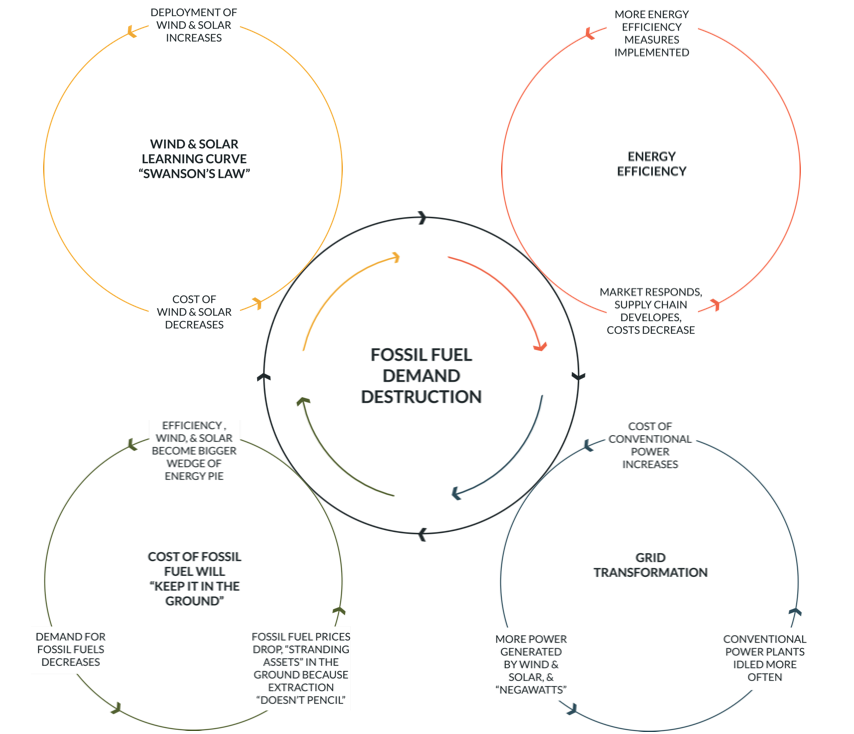
As Carbon Tracker Initiative says, climate security equals fossil fuel demand destruction. Done right, high performance building equals climate action.
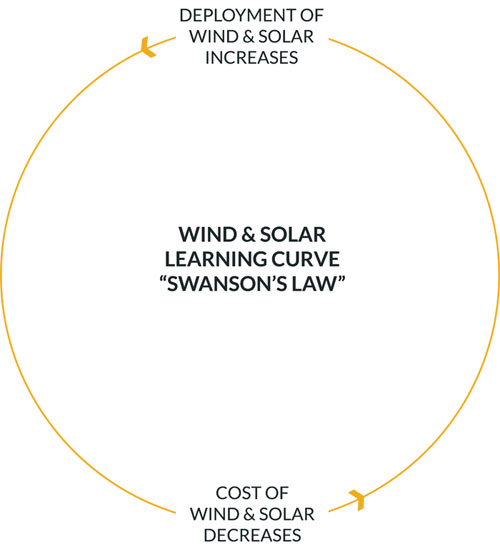
In my post, “Who’s Afraid of the Big, Bad Jevons Paradox? (Climate Hope Part I),” I highlighted the vicious cycles that can drive nonlinear change and threaten runaway climate change. It turns out we have some exciting virtuous circles that we can be part of propelling on the solutions side to drive nonlinear change on the positive side of the ledger. We’re essentially in a race against time, and it’s impossible to know for sure if the virtuous circles will win the race against the vicious cycles. But what is certain, in my view, is that we can play an important role in accelerating the virtuous circles that destroy demand for fossil fuels.
First, there’s the wind and solar learning curve that we’ve discussed:
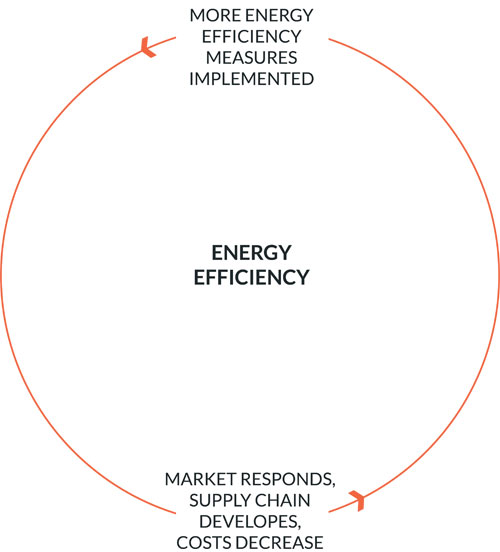
Second, there’s an analogous process in energy efficiency. As we create more Passive Houses and other high performance buildings we get better at delivering these projects cost-effectively which means more clients choose to invest in über-efficiency. As we as an industry grab more market share, suppliers will respond with better building components at lower prices. This in turn makes it easier for us to deliver energy efficiency inexpensively and the virtuous circle accelerates.
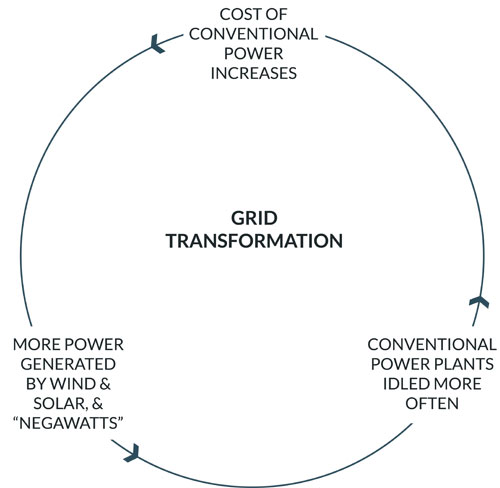
Third, as we deliver more “negawatts” to the grid via energy efficiency and more clean electrons to the grid via renewables that means conventional power plants are idled more often, which, all things equal, makes the cost of conventional power to go up, which makes “negawatts” and clean electrons more competitive. Another virtuous circle accelerates as the grid transforms.
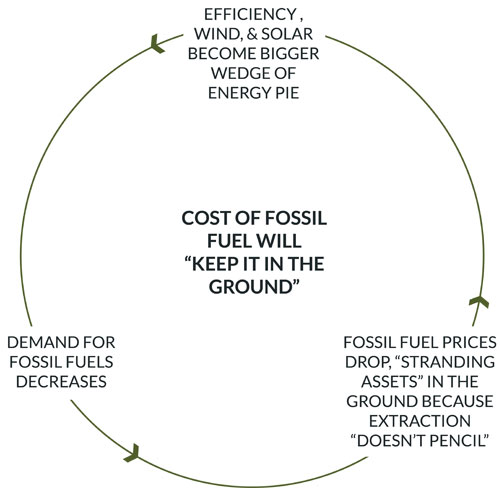
Finally, as demand for fossil fuels wanes, more fossil fuels are stranded in the ground. A process that is accelerated by increasing market share of renewables and falling prices of renewables.
All of these virtuous circles (and potentially more – we haven’t even touched on the potential role of electric vehicles in reducing demand for oil and providing storage for renewables) get us closer to climate security by destroying demand for fossil fuels.
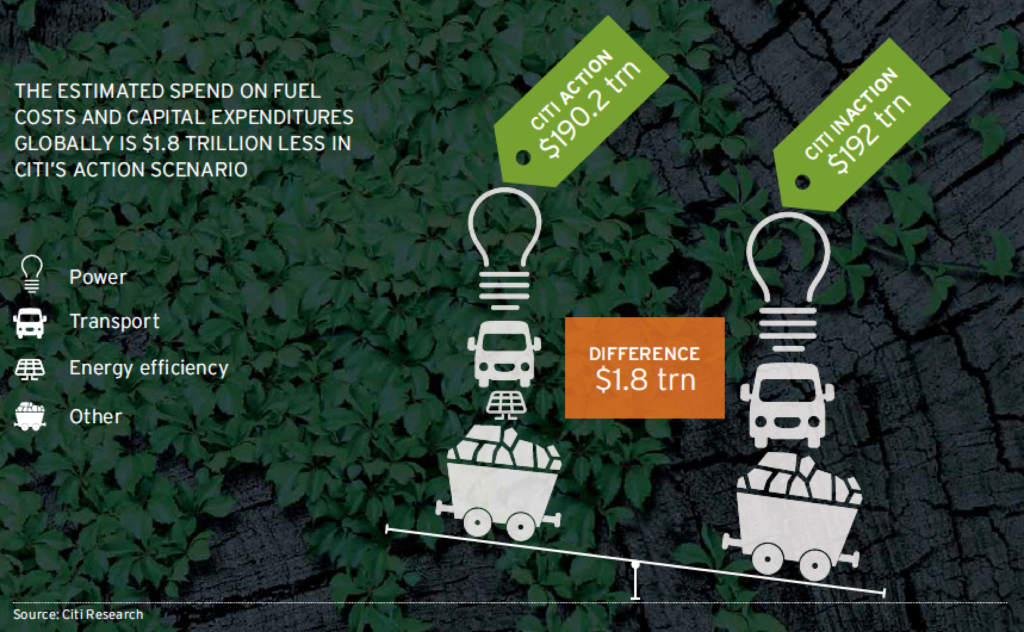
It won’t be easy. The transformation that needs to take place will require considerable upfront capital investments in renewable energy and energy efficiency. Though, again according to CitiGPS, the savings earned from those upfront investments actually makes a course of climate action cheaper over time than a course of inaction, as shown in this infographic shared in the Energy Darwinism II report:
The takeaway for me is this: those of us concerned about climate change have been right to decry climate denialism. It breeds inaction by distorting our understanding of the problem. (“Relax, there is no problem.”) But we should be equally vigilant about climate defeatism, because it also breeds inaction, but it does so by distorting our understanding of the solutions. By saying climate action is too expensive, despite CitiBank telling us the opposite. Or by citing the Jevons Paradox to argue that energy efficiency is actually counterproductive. Or by saying it’s pointless anyway because fossil fuel companies are just gonna dig it all up and burn it all regardless.
The reality is that we have the means at our fingertips to transform the energy performance of the built environment and play a starring role in climate solution making.
So let’s do it.
Back to Field Notes