I’ve been thinking a lot about the climate crisis lately. What can I do to address such a huge problem? Is a path to a positive future for my children still possible? Is there real potential for securing a livable future?
At Hammer & Hand we view Passive House and Net Zero Energy building as forms of climate action. But when I tout the planetary benefits of high performance building and distributed energy production, am I being honest with myself? With our clients? With our collaborators? When we build a Passive House and put a solar array on the roof, are we truly part of the solution?
Just over a year ago I started pulling on this thread of inquiry. It led me to a deep dive into the Jevons Paradox, to a crash course on the raging battle between the economics of fossil fuel extraction versus renewable energy production, and to a discovery of the nonlinear nature of both the risks posed by climate change and their potential solutions.
It also led me to a place of climate hope.
The journey coalesced into a presentation that I began making to colleagues in the high performance building community, including keynotes at the North American Passive House Conference, the Passive House Northwest Conference, and elsewhere. So it feels like time to share a written version here on H&H’s Field Notes blog. (Note that we published previous versions of some of these ideas here and here.)

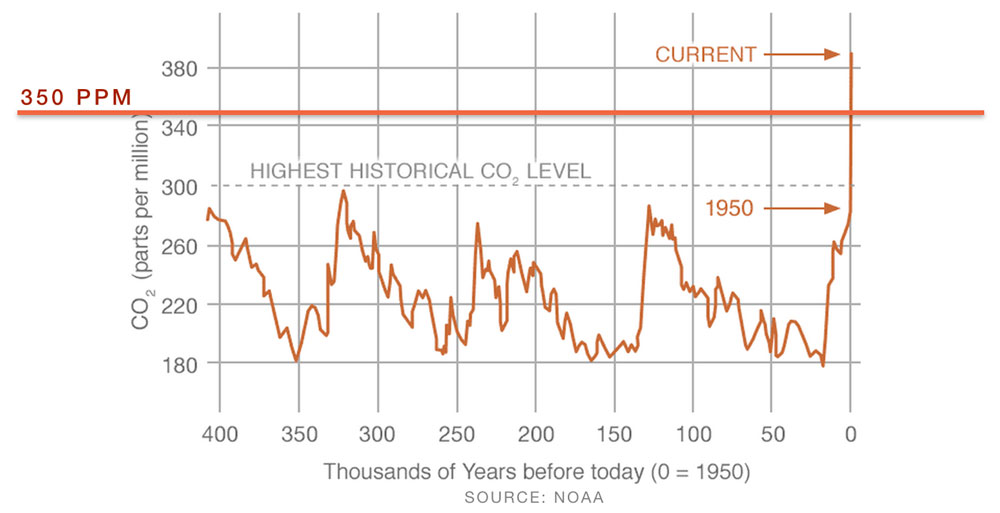
Humanity has embarked on a vast planetary experiment in atmospheric makeup, oceanic chemistry, altered weather systems, and global temperature rise. We’ve blown past the line of 350 parts per million of atmospheric carbon dioxide concentrations that climate scientist James Hansen outlined when he was at NASA as a line of safety that we should not cross. The graph below shows our unprecedented trajectory; we’ve already reached past 400ppm of carbon dioxide in the atmosphere, higher than at any point in the last half million years.
This change in the makeup of our atmosphere is already having major impacts on the planet. This should come as no surprise. After all, the heat trapped by human-induced greenhouse gas emissions is now equivalent to the energy that would be released into the atmosphere by the daily detonation of 400,000 Hiroshima bombs, 365 days a year.
The sky looks big, so we tend to think that our atmosphere is vast. But in reality it’s a surprisingly thin membrane enveloping the planet. If the Earth were an apple, the atmosphere would be thinner than the skin of that apple. Yet this fragile layer protects us and makes life on Earth possible.

Sunrise from the International Space Station
The carbon pollution that we’re pumping into the atmosphere threatens this life. From melting ice, to acidified and oxygen-depleted oceans, to withering heat and dust-bowlification, to droughts and destructive deluges, to multi-meter sea level rise in our lifetimes, to mass extinctions and famine, to unprecedented humanitarian crises and security pressures caused by the displacement of millions of climate refugees – the stakes are high.
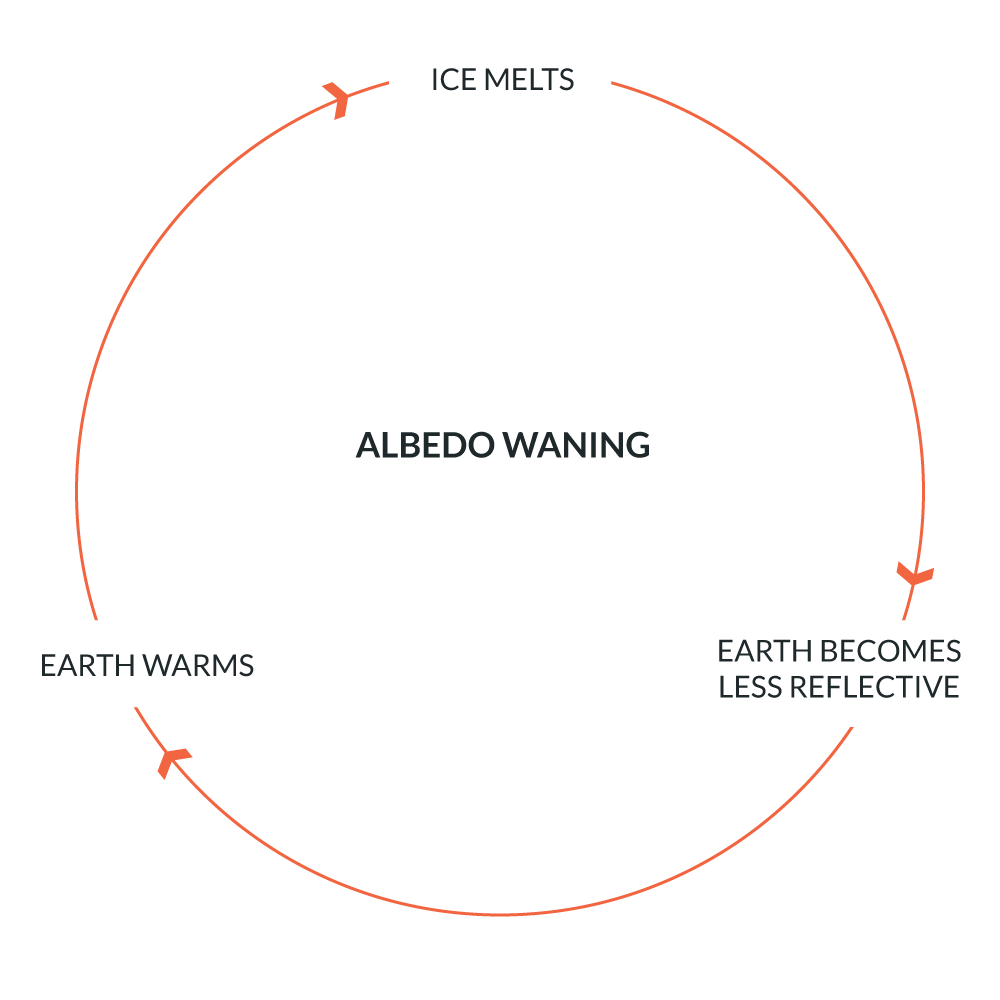
You likely know much of this, so I won’t dwell here on the myriad of impacts from climate disruption. But I do want to point out that one of the reasons that climate change is so dangerous is that it is full of feedback loops – vicious circles – that threaten to drive nonlinear (exponential) runaway change. For students of climate change, often the first such feedback loop we learn about is that of waning albedo. Albedo is the reflectivity of the Earth. The more white ice we’ve got covering the planet, the greater the albedo effect and the greater portion of the sun’s rays is reflected off the Earth as light, back out into space. But with global warming and melting ice sheets we have less ice, so more of the sun’s rays are absorbed by the Earth as heat energy. This warms the planet more, which melts more ice, which reduces albedo, which leads to more heat absorption, which warms the planet more, which melts more ice, and so on. You’ve got yourself a vicious circle feedback loop.
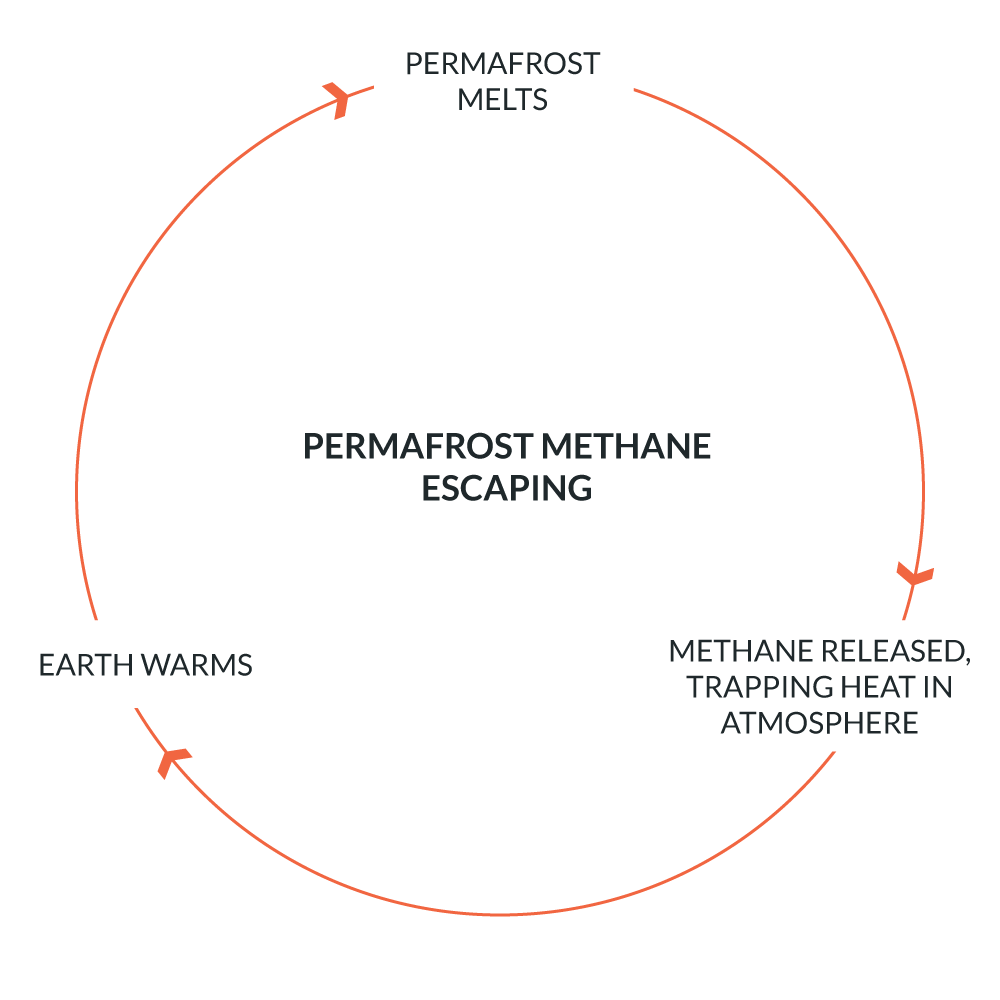
Methane released from melting permafrost is another such vicious cycle. As warming causes permafrost to melt, much of the methane trapped in that permafrost will be released into the atmosphere. Though relatively short-lived as a greenhouse gas compared to carbon dioxide, methane is a much more potent one. The released methane accelerates warming, more permafrost melts, releasing more methane, leading to more warming, melting more permafrost, and you’ve got yourself another vicious circle.
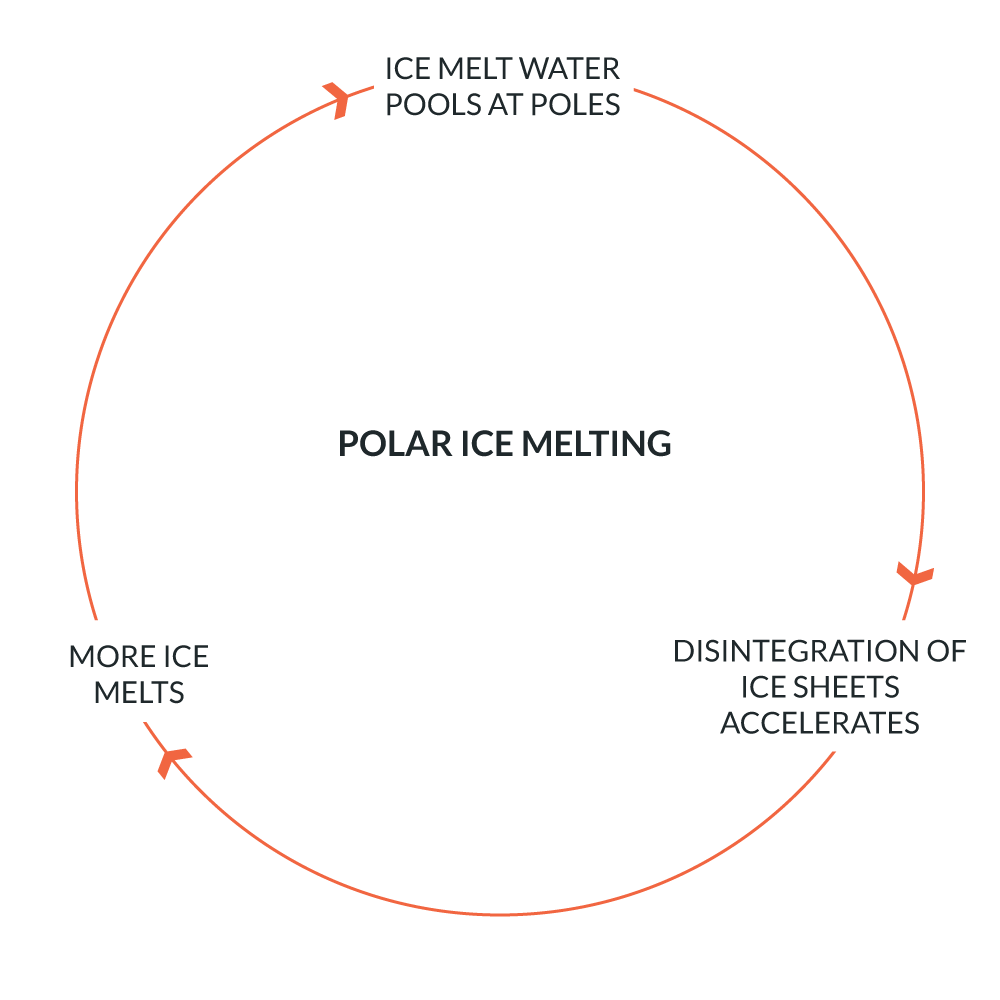
James Hansen and 18 other climate scientists recently made headlines warning of the possibility of multi-meter sea level rise by the end of this century if we don’t significantly curb emissions, a sharp departure from the much more modest and incremental predictions made by the Intergovernmental Panel on Climate Change (IPCC). The reason for their steep revision is that their research uncovered what they believe to be a feedback loop driving exponential increases in the melting of ice sheets. As ice melt water pools at the poles it triggers a process that accelerates the disintegration of ice sheets, which speeds melting, which causes more melt water to pool at the poles, which accelerates the disintegration of ice sheets, and so on: another vicious circle.
The point is that with climate change risk we’re in nonlinear change territory. It’s a realm of tipping points and looming system disruptions.
One piece of good news is that more and more of us understand the urgency of climate action. When you look at the options for climate action, the solution making sorts into a few categories:
- Conserve energy and use it more efficiently.
- Transition from fossil fuels to clean energy.
- Improve land use (reforest and improve stewardship of soils).
- Geoengineering (fraught with peril from unintended consequences).
Some emphasize population as a key piece of the climate action puzzle, which is fine, as long as the focus is then on equity, education, and empowerment rather than on coercion. In his book, The Future, Al Gore cites the four conditions that, combined, foster declining population growth rates: 1. Low infant morality rates, 2. Education for girls, 3. Empowerment of women, and 4. Universal access to contraception. Worldwatch Institute has its own list of “Nine Population Strategies to Stop Short of 9 Billion.”
The Kaya Identity, developed by economist Yoichi Kaya, nicely summarizes both the math behind greenhouse gas emissions and the potential levers for climate action:

If we want a future of zero emissions, then one or more of these circles needs to reach zero. We know that population will likely increase in the coming decades, so that first circle will grow. We hope that GDP per capita will increase as billions of people rise out of poverty around the world, so that second circle will likely grow, too. That means that we need to make major progress with the energy intensity and carbon intensity of global economies and shrink those two circles toward zero if we hope to reach zero emissions. That means a revolution in energy efficiency and renewable energy generation. (Passive House and Net Positive Energy Building suddenly look really relevant.)
And make no mistake, zero emissions is where we need to head. The current international consensus articulated in Paris is that we need to reach negative emissions during the second half of this century if we want to limit warming to 1.5 degrees C. The bottom line graphed on this chart below shows the trajectory we will need to follow during the first half of this century:
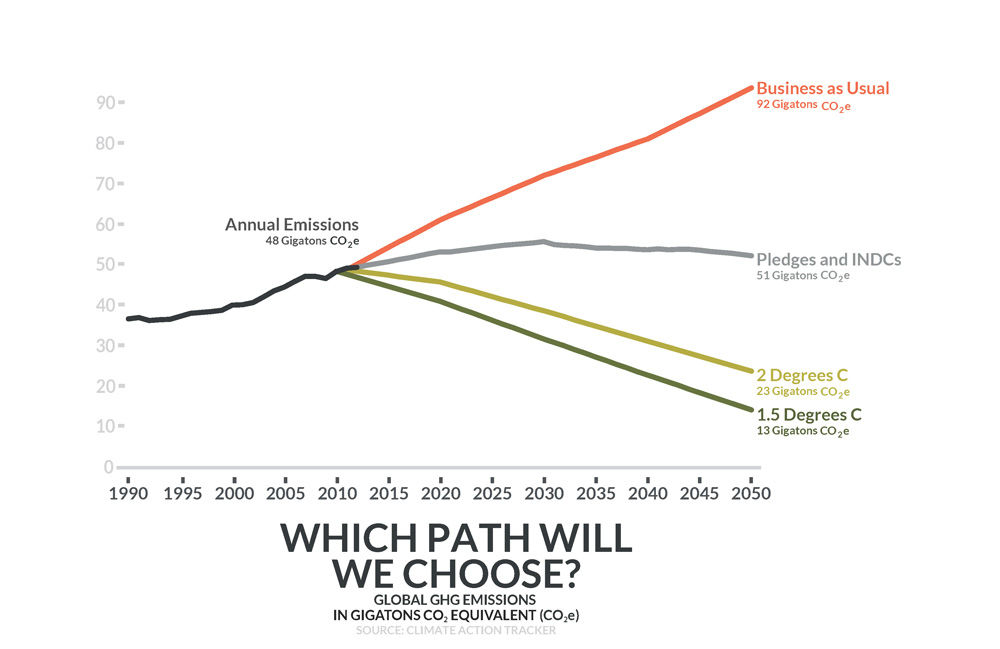
In order to limit warming to 1.5 degrees C, we need to reduce greenhouse gas emissions by 73% by 2050, from about 48 gigatons of CO2 equivalent emitted annually today, to 13 gigatons of CO2 equivalent emitted by 2050. This reduction needs to happen in the face of population growth and economic development that would otherwise, if we continued with business as usual burning of fossil fuels, take us to 92 gigatons of CO2 equivalent emitted annually in 2050.
No small feat.
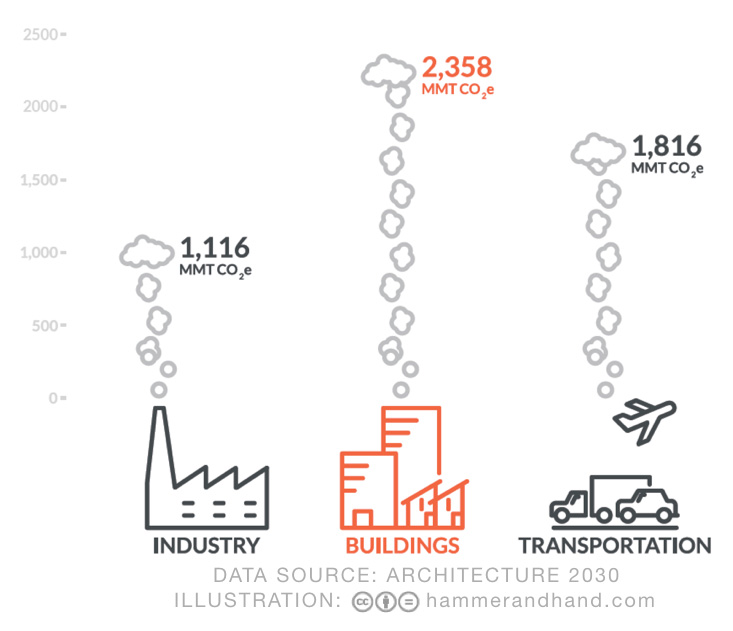
We in the high performance building industry understand that buildings are currently part of the problem. According to Architecture 2030, nearly half of US carbon dioxide emissions comes from the building sector, and most of that from the operations of our buildings.
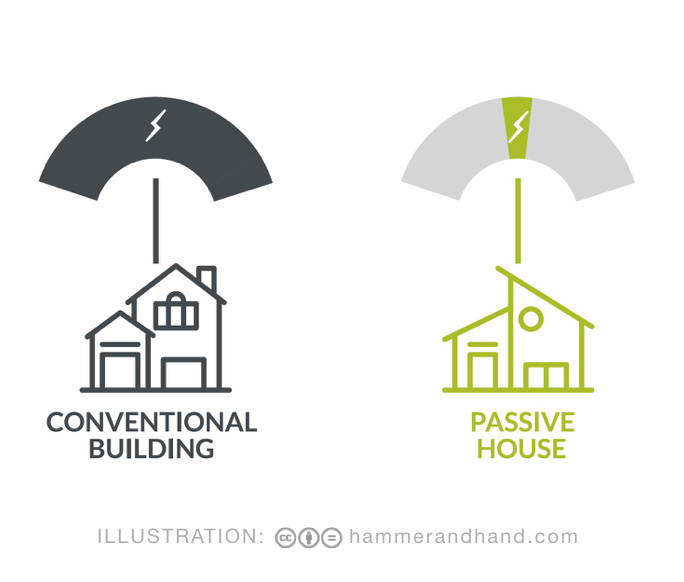
But we also know that if buildings are part of the problem, they can also be part of the solution. And through Passive House design and construction we have the means at our fingertips to reduce building heating energy by 90% and overall building energy use by 60-70%. It’s a field-tested, predictable, and cost-effective way to transform the energy performance of our building stock.
So we can pat ourselves on the back, right? Through Passive House we’re part of the solution: building and retrofitting as climate action. Great!
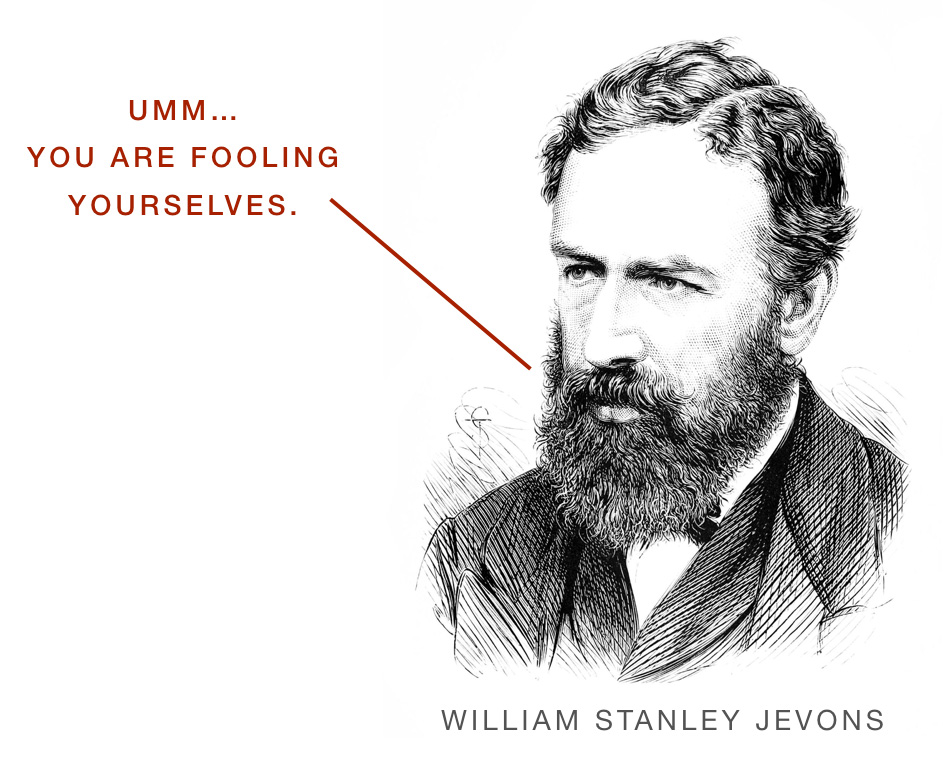
But wait. Not so, says William Stanley Jevons.
Jevons was a Scottish economist who wrote The Coal Question in 1865. In this book he says:
“It is wholly a confusion of ideas to suppose that the economical use of fuel is equivalent to a diminished consumption. The very contrary is the truth.”
According to Jevons, we are confused if we think energy efficiency reduces energy consumption. In fact, Jevons argues that energy efficiency increases energy consumption rather than reducing it.
Jevons wrote The Coal Question at a time when he and others were growing increasingly concerned about Britain’s dwindling coal supply. Energy efficiency seemed natural as a means of mitigating this limited energy supply, but what Jevons observed with the über-efficient James Watt steam engine caused him to believe otherwise. And these observations became the basis of what is now known as the Jevons Paradox.
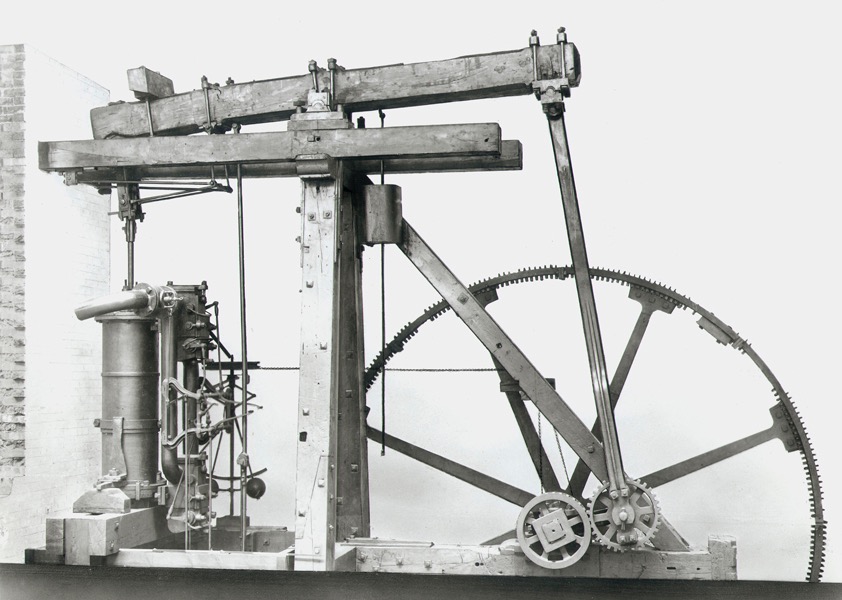 Image source: Science Museum Group
The James Watt steam engine, which came on the scene between 1763 and 1775 was a technological breakthrough. It quintupled engine efficiency and used 75% less coal than its predecessor, the Thomas Newcomen steam engine. So it could do much more work using a lot less coal.
Great news, right? Coal consumption would go down thanks to this efficiency and the longevity of Britain’s coal supply would increase significantly. But that’s not what happened. Instead, coal consumption began an exponential increase, so that by the time Jevons was writing The Coal Question, annual coal production in Britain had increased from about 5 million tons annually shortly before the invention of the Watt steam engine to over 100 million tons annually in 1865.
The reason for this? The Watt steam engine was so good at what it did that people started using it for everything, and it became one of the major drivers of the Industrial Revolution. From textiles, to transport, to manufacturing, to mining more coal – you name it – the Watt steam engine was churning away. This huge increase in the use of steam engines made the efficiency of the Watt steam engine counterproductive in reducing coal consumption. In Jevons’ words:
“Whatever, therefore, conduces to increase the efficiency of coal, and to diminish the cost of its use, directly tends to augment the value of the steam-engine, and to enlarge the field of its operations.”
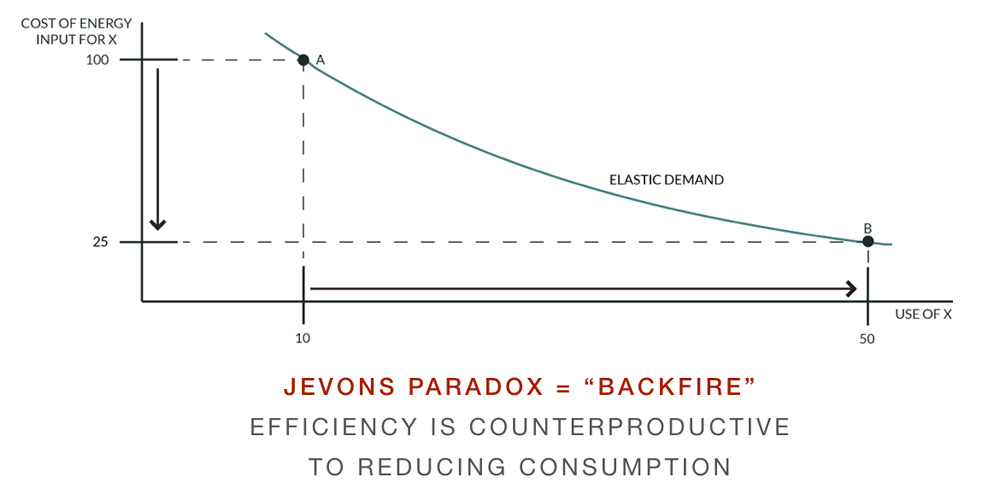
In the graph below you see that the energy efficiency of the steam engine resulted in a 75% decrease in the cost of energy input, which resulted in, hypothetically, a 500% increase in the use of steam engines. So the energy efficiency of the Watt steam engine backfired in terms of reducing coal consumption. Two conditions were in place to set up this very elastic demand curve relative to energy that defines the Jevons Paradox. First, the steam engine and the processes that it was applied to had to be very sensitive to the cost of the energy input. Second, there had to be lots of pent up demand for cheap production. And early in the Industrial Revolution, there was nearly endless demand for cheap production.
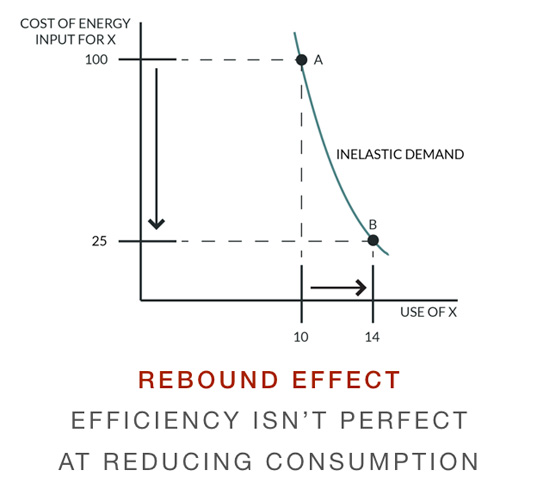
The thing is, we’re much more likely to see inelastic demand curves in relation to energy, like the one below. That’s because, for most products, services, and processes, energy is just one of many inputs, so they are relatively insensitive to the cost of energy. In these scenarios a 75% reduction in the cost of the energy input thanks to energy efficiency might result in, as shown in the example below, a 40% increase in the use of that product, service, or process. This energy efficiency rebound is far smaller than the backfire of the Jevons Paradox. With these smaller rebounds, efficiency isn’t perfect at reducing consumption, but it’s still effective.
Consider a Prius driver. Priuses are roughly twice as fuel efficient as other cars on the road, but you don’t see Prius drivers driving twice as much as the rest of us. That’s because there are lots of considerations that go into the decision to drive, not just the cost of the gasoline input. It is true that a Prius driver is saving money at the pump compared to the rest of us, and perhaps she uses some of that money to drive a bit more (though as this data shows, it appears that Prius drivers don’t actually increase their driving at all.) Or maybe she uses some of the saved money to buy an iPad, which required energy to produce and uses some energy to use. So there’s a rebound there; some of the money saved from the fuel efficiency of the Prius is spent on greater energy consumption. Then again, maybe she is feeling virtuous and uses the money saved at the pump to switch from conventional veggies to organic ones. Or maybe she uses it to invest in a deep energy retrofit of her house! The point is that what she buys with the money she saved at the pump matters. That pattern of spending will likely mirror her overall spending habits, only some of which consumes energy. Given that 6-8% of US GDP is spent on energy, we’re not talking big rebounds with these individual spending decisions.
The late Dr. Lee Schipper, professor at Berkeley and then Stanford, put it well in his quote to the New Yorker’s Dave Owen:
“The key to understanding Jevons is that processes, products, and activities where energy is a very high part of the cost – in this country, a few metals, a few chemicals, air travel – are the only ones whose variable cost is very sensitive to energy. That’s it.” (Quoted in the article, “The Efficiency Dilemma,” from The New Yorker’s December 20 and 27, 2010 issue.)
The things in our economy that are very sensitive to cost of energy are few and far between: “a few metals, a few chemicals, air travel.” Those are the things that are potentially exposed to the energy efficiency backfire of the Jevons Paradox. Everywhere else we’re in much smaller energy efficiency rebound territory.
So why are we still talking about the Jevons Paradox today, 150 years after Jevons wrote The Coal Question? One answer is “politics.” The Jevons Paradox and its narratives are just too attractive to folks opposed to energy efficiency mandates to let the idea die, so a cottage industry of Jevons Paradox storytelling has emerged. That’s why you see Jevons crop up on the opinion pages of the Wall Street Journal, in the writings of the libertarian Cato Institute, and in the agenda of the Breakthrough Institute.
The Breakthrough Institute (totally unrelated to Bill Gates’ Breakthrough Energy Coalition, by the way) is an interesting one. They’ve got their branding down. They describe themselves as an “eco-modernist think tank,” so they paint themselves with a green brush, though when you understand their agenda it’s tough not to see that as just a form of sheep’s clothing. They say that they are pro-climate, but they are also opposed to efficiency mandates, carbon pricing, and most forms of renewable energy. They are pro-nuke and pro-gas, and definitely pro-Jevons Paradox. Indeed, much of the marketing of the Jevons Paradox originates with these guys, including much of the economics writing meant to prove that the paradox is relevant today.
When you hear the Jevons Paradox being brought up, you’ll likely hear the sound of a political axe grinding, too.
But don’t take my word for it. Let’s look at one of the favorite narratives that Jevons Paradox boosters tell, the story of the doublewide fridge, and see how it holds up to a bit of scrutiny.

The story goes like this…
Back in the ‘40s when fridges first came onto the scene they were very energy inefficient. But over time fridge efficiency has steadily increased, partly driven by energy efficiency mandates that have spurred technological improvements and innovations by manufacturers, so today we have superefficient, ENERGY STAR fridges.
Back in the ‘40s when fridges first came onto the scene they were also quite small. But over time, fridges have gotten bigger and bigger, until today, behold, the doublewide fridge in the American kitchen!
According to the Jevons Paradox, energy efficiency causes more energy consumption, not less, and here’s the proof! Fridge efficiency caused fridge size to increase! (Fridge size serves as a proxy for energy consumption in this narrative.)
Never mind that a perfectly plausible explanation for the emergence of the doublewide fridge in the American kitchen is that we’ve become wealthier since the 1940s and have larger houses with big kitchens that can fit big fridges. This would argue that it is our affluence, not fridge energy efficiency, that has caused fridges to increase in size. But let’s take a closer look.
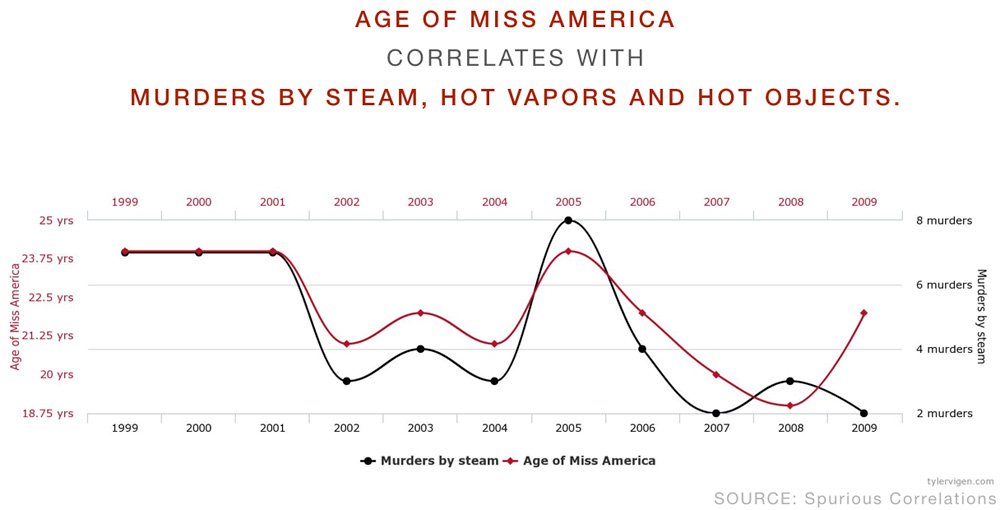
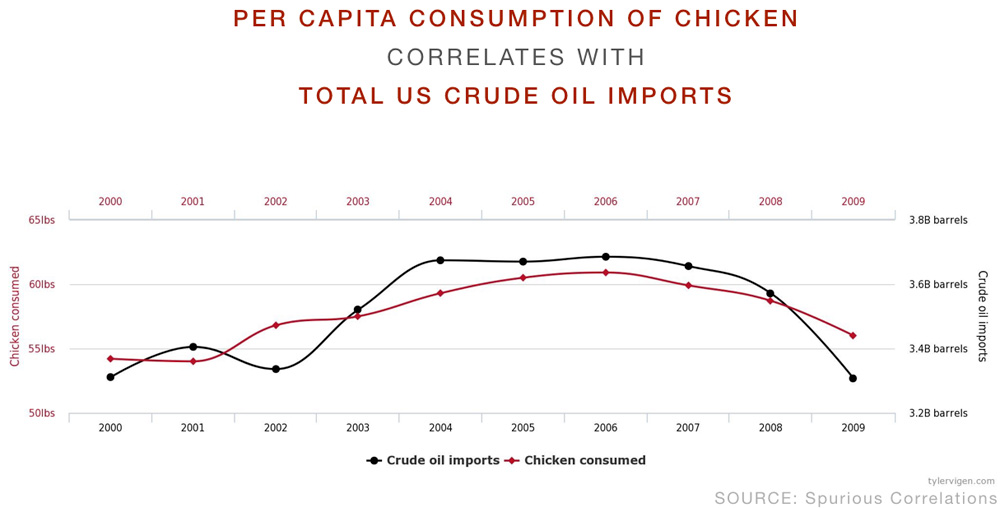
First, it’s important to note that correlation does not equal causation. For example, here we see that murders by steam, hot vapor, and hot objects correlates closely with the age of Miss America on any given year:
And here that per capita consumption of chicken is highly correlated with total US crude oil imports:
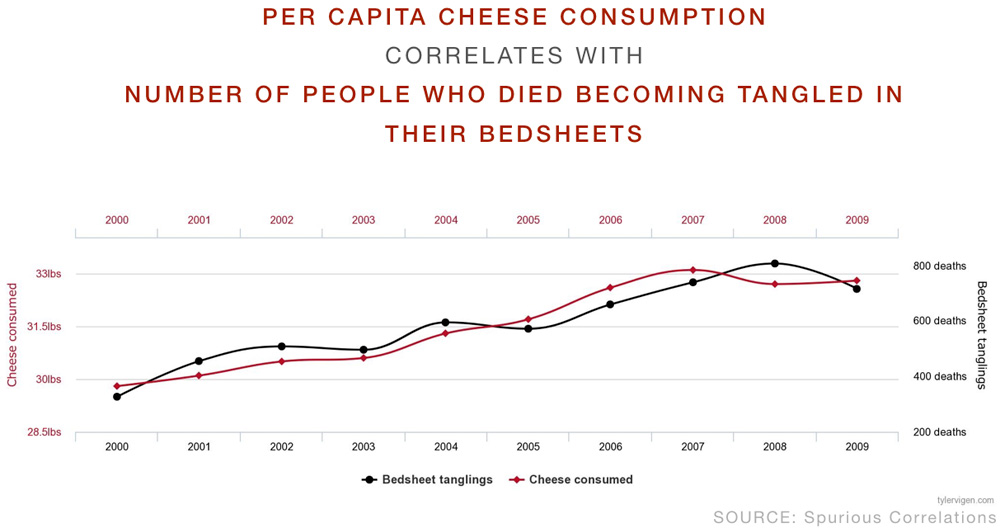
Or perhaps most alarming, particularly for you cheese lovers, per capita cheese consumption correlates highly with the number of people who die becoming tangled in their bed sheets:
Okay, so we know that correlation doesn’t equal causation. However, if the Jevons Paradox truly were at play with fridge size, then we should expect fridge efficiency and fridge size to track closely together and a graph of those two variables to look much like the bed sheet entanglement graph above. Instead, this is what the graph looks like:
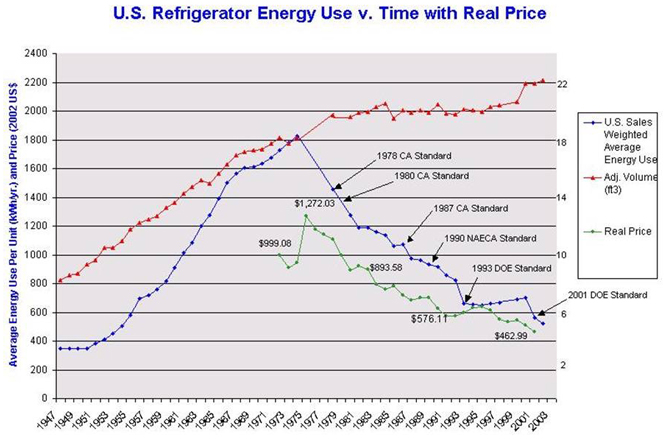
Physicist David Goldstein of NRDC shared this graph as part of his article debunking the Jevons Paradox. The red line shows fridge size from 1947 to 2003. For the first few decades fridge size increases rapidly until about halfway when fridge size flattens out for two decades followed by a little blip at the end. The blue line shows fridge energy use, so it shows an inverse relationship with energy efficiency. Fridge energy use climbs rapidly for a few decades until 1979 when it suddenly reverses direction and falls dramatically in response to the first energy efficiency mandate, the 1978 CA Standard. Fridge energy use continues to fall over the remaining decades as subsequent energy efficiency mandates are put into place and fridge efficiency increases.
Remember that if the Jevons Paradox were at work with fridge size that we should see fridge size spike just as energy efficiency improves, because energy efficiency supposedly causes greater consumption, not less. So, if the Jevons Paradox were true here we should see that red line spike upwards just as that blue line begins its free fall. But instead we see that red line flatten out at just that moment. No evidence for the Jevons Paradox.
It’s not that energy efficiency rebounds aren’t real, it’s just that they’re small. A survey of the economics literature about rebound effects published by the Energy Journal found a 10-30% rebound in the residential and transportation sectors and a 0-20% rebound in the industrial sector. The conclusion, then, is that energy efficiency is 70-100% effective at reducing energy consumption: not perfect, but quite good. And in the world of über-efficient buildings, like Passive House, the rebound effect is likely to be quite small or nonexistent. This is because really efficient buildings usually require an upfront financial investment in building energy performance. And while that upfront investment is offset by decades of ongoing utility bill savings, those savings and that upfront investment balance themselves out. There isn’t a bunch of extra “energy efficiency” cash left over to fritter away on stuff and activities that burn energy.
So far we’ve been talking about stuff at the microeconomic scale – the scale of cars, fridges, and houses – and the Jevons folks have had a hard time finding any proof here for their paradox. So they’ve largely pivoted to the macroeconomic scale – the scale of entire economies. This is inherently murkier territory because it’s harder to prove or disprove theories in macroeconomics. It’s a realm more of idealized mathematic models than of empiricism. But this is the current refuge for Jevons Paradox proponents.
The macroeconomic story goes like this…
Back in 1650 we were lighting our buildings with candles – very energy inefficient. Fast-forward to 2016 and we’ve got super-efficient LED light bulbs. Similarly, back in 1650 we were heating our buildings with terribly inefficient fireplaces. Today we’ve got miraculous heat pump technology and high efficiency furnaces. In fact, if you look at most any technology you’ll see big jumps in energy efficiency over time. However, between 1650 and today our per capita use of energy has increased ten-fold:
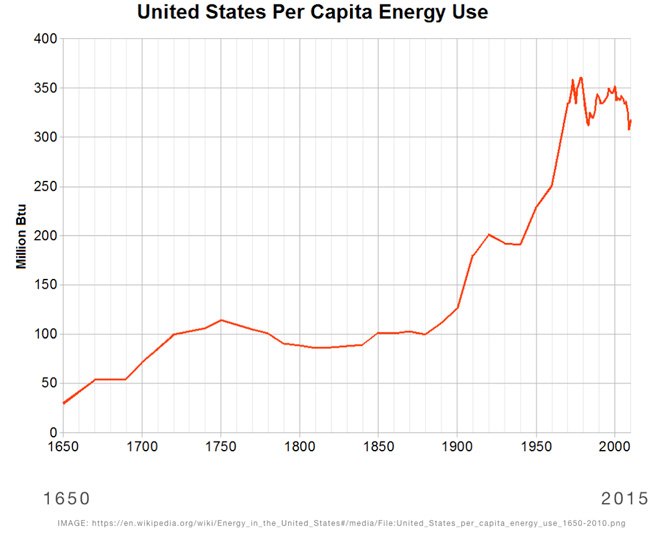
“Aha!” say the proponents of the Jevons Paradox. Here’s the proof! Jevons says that energy efficiency causes more energy consumption not less. The society-wide advances in energy efficiency have therefore caused our energy consumption to skyrocket. It’s all just one giant energy efficiency backfire.
Shouldn’t the burden of proof be on the paradoxical explanation for a set of conditions when a totally plausible explanation explains the same conditions? (Call it a variant of Occam’s Razor.) In this case, the totally plausible explanation is two-pronged. First, we have become much richer as a society over the past few centuries and have lots more money to spend on stuff that burns energy. Second, we’ve invented lots of machines, like the internal combustion engine, that are really good at burning energy. It’s not the fuel efficiency of cars that’s driven our energy consumption up but rather the initial invention of the technology followed by Henry Ford’s genius for mass-producing cars that Americans could afford to buy. It hasn’t been energy efficiency but rather the pairing of affluence with energy-intensive technology that has led to greater energy consumption.
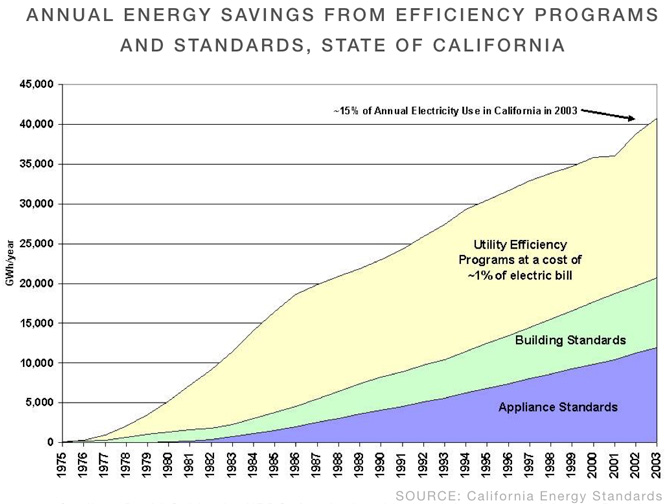
But we can run a quick test and compare two economies side by side, as David Goldstein did, to see if the one that mandates energy efficiency ends up having higher per capita energy consumption, as the Jevons Paradox predicts. Goldstein looked at California, which has been ahead of the rest of the country on energy efficiency programs for decades, and compared it with the rest of the United States. This graph from the California Energy Commission shows the cumulative effect of the various efficiency standards in place in California, from 1975 to 2003:
If the Jevons Paradox operated at the macroeconomic scale, then we should expect to see Californian’s energy use to begin to spike in 1974 and continue to rise as energy efficiency measures are ratcheted in over the years. Sounds crazy, but that’s what the paradox calls for. Energy efficiency is supposed to increase consumption not reduce it.
That is not what happens.
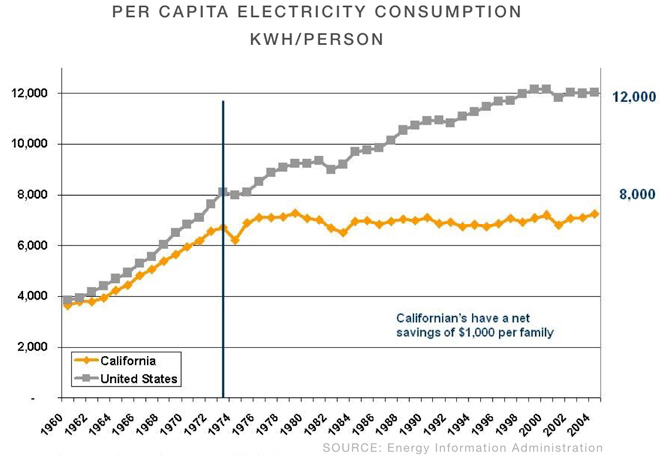
The orange line shows per capita electricity use of Californians. That vertical black line represents the beginning of energy efficiency mandates in California. Electricity use by Californians does not spike, but rather flattens out. Meanwhile, electricity consumption of the rest of us in the United States continues to climb, likely due to the lack of California style energy efficiency mandates.
No evidence for the Jevons Paradox here. Which brings me to this quote, shared by Amory Lovins during his discussion of Jevons:
“Sometimes a concept is baffling not because it is profound, but because it is wrong.” – Dr. E.O. Wilson, Harvard University
Maybe the Jevons Paradox simply isn’t relevant to our world today.
But even if is and the Paradox is hiding in the macroeconomic data somewhere, there is one simple and widely accepted cure for it and all the smaller energy efficiency rebounds we’ve been talking about: put a price on carbon. And while that still feels like a heavy lift politically, there is finally some progress. Washington State has a carbon tax proposal on the ballot this fall, and another proposal waiting in the wings. Massachusetts is working on one. BC has one. The World Bank is advocating for carbon taxes around the world. And these guys below banded together to advocate for one during the months leading up to COP21 in Paris!

I’m not saying I have a ton of trust for these guys, but we’re talking about six oil majors advocating for a meaningful carbon tax. There are a few theories about why. The most skeptical is that these companies figure a carbon tax won’t actually happen anyway, so they look good asking for one. Another thought is if they’re involved and at the table these oil majors can make sure the tax is low. A third theory is that because a carbon tax impacts coal much more than oil, it makes sense for the oil majors to support because then they beat coal. Finally, given the increasing likelihood of meaningful governmental action on emissions, these companies may see a carbon tax as the most palatable option for public intervention.
The six big banks below also think pricing carbon is a good idea and can be implemented in a way that is conducive to economic growth:

Whatever the reasons for these actions by oil and banks, it’s clear that the ground is beginning to shift.
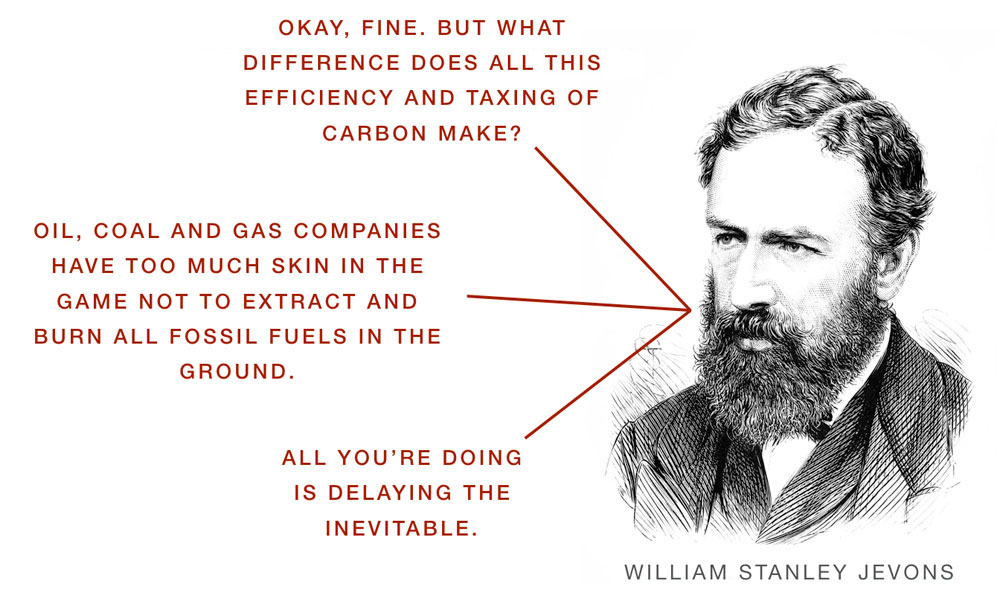
Okay, so full disclosure: Jevons never said this. It’s possible that I’ve spent a little too much time thinking about this guy over the past several months, so he’s playing some combination of nemesis and devil’s advocate here. But the fossil fuel companies do have tremendous power and tremendous financial stake in what happens with the coal, oil, and gas that currently sits buried in the ground. What’s to keep them from just digging it all up, drilling it all, and burning it?
And if that happens, all bets are off. Among the many catastrophic consequences of “burning it all” would be the melting of the Antarctic and Greenland ice sheets and much more, besides. That would put us in 200-250 foot sea level rise territory. We’re talking climate impacts at a biblical scale.
So is it true? Will we just burn it all? Are we just delaying the inevitable?
Stay tuned for the next installment: “Swans, Buildings, and Climate Action.”
Back to Field Notes